UNITED STATES
SECURITIES AND EXCHANGE COMMISSION
Washington, D.C. 20549
_________________________________________________
FORM 10-K
(Mark One)
[X] ANNUAL REPORT PURSUANT TO SECTION 13 OR 15(d) OF THE SECURITIES EXCHANGE ACT OF 1934
For the fiscal year ended June 30, 2019
OR
[ ] TRANSITION REPORT PURSUANT TO SECTION 13 OR 15(d) OF THE SECURITIES EXCHANGE ACT OF 1934
For the transition period from to
Commission file number 1-11692
_________________________________________________

Ethan Allen Interiors Inc.
(Exact name of registrant as specified in its charter)
|
Delaware
|
|
06-1275288
|
|
(State or other jurisdiction of incorporation or organization)
|
|
(I.R.S. Employer Identification No.)
|
|
25 Lake Avenue Ext., Danbury, Connecticut
|
|
06811-5286
|
|
(Address of principal executive offices)
|
|
(Zip Code)
|
(203) 743-8000
(Registrant's telephone number, including area code)
Securities registered pursuant to Section 12(b) of the Act:
|
Common stock $0.01 par value
|
|
ETH
|
|
New York Stock Exchange
|
|
(Title of each class)
|
|
(Trading symbol)
|
|
(Name of exchange on which registered)
|
Securities registered pursuant to Section 12(g) of the Act: None
Indicate by check mark if the registrant is a well-known seasoned issuer, as defined in Rule 405 of the Securities Act. [ ] Yes [X] No
Indicate by check mark if the registrant is not required to file reports pursuant to Section 13 or Section 15(d) of the Act. [ ] Yes [X] No
Indicate by check mark whether the registrant (1) has filed all reports required to be filed by Section 13 or 15(d) of the Securities Exchange Act of 1934 during the preceding 12 months (or for such shorter period that the registrant was required to file such reports), and (2) has been subject to such filing requirements for the past 90 days. [X] Yes [ ] No
Indicate by check mark whether the registrant has submitted electronically every Interactive Data File required to be submitted pursuant to Rule 405 of Regulation S-T (§232.405 of this chapter) during the preceding 12 months (or for such shorter period that the registrant was required to submit such files). [X] Yes [ ] No
Indicate by check mark whether the registrant is a large accelerated filer, an accelerated filer, a non-accelerated filer, smaller reporting company or an emerging growth company. See the definitions of “large accelerated filer,” “accelerated filer,” “smaller reporting company,” and “emerging growth company” in Rule 12b-2 of the Exchange Act:
|
Large accelerated filer [ ]
|
Accelerated filer [X]
|
|
Non-accelerated filer [ ]
|
Smaller reporting company [ ]
|
|
Emerging growth company [ ]
|
|
If an emerging growth company, indicate by check mark if the registrant has elected not to use the extended transition period for complying with any new or revised financial accounting standards provided pursuant to section 13(a) of the Exchange Act. [ ]
Indicate by check mark whether the registrant is a shell company (as defined in Rule 12b-2 of the Act). [ ] Yes [X] No
The aggregate market value of the voting and non-voting stock held by non-affiliates of the registrant on December 31, 2018, the last business day of the registrant’s most recently completed second fiscal quarter, was approximately $419,386,567. The number of shares outstanding of the registrant’s common stock, $0.01 par value, as of July 25, 2019 was 26,586,945.
DOCUMENTS INCORPORATED BY REFERENCE
Portions of the registrant’s definitive proxy statement to be filed with the Securities and Exchange Commission pursuant to Regulation 14A for its 2019 Annual Meeting of Stockholders are incorporated by reference into Part III of this Annual Report on Form 10-K where indicated. Such proxy statement will be filed with the Securities and Exchange Commission within 120 days of the registrant’s fiscal year ended June 30, 2019.
ETHAN ALLEN INTERIORS INC. AND SUBSIDIARIES
TABLE OF CONTENTS
|
PART I
|
|
|
| |
|
|
|
Item 1.
|
Business
|
5
|
| |
|
|
|
Item 1A.
|
Risk Factors
|
12
|
| |
|
|
|
Item 1B.
|
Unresolved Staff Comments
|
17
|
| |
|
|
|
Item 2.
|
Properties
|
18
|
| |
|
|
|
Item 3.
|
Legal Proceedings
|
19
|
| |
|
|
|
Item 4.
|
Mine Safety Disclosures
|
19
|
| |
|
|
|
PART II
|
|
|
| |
|
|
|
Item 5.
|
Market for Registrant's Common Equity, Related Stockholder Matters and Issuer Purchases of Equity Securities |
20 |
| |
|
|
|
Item 6.
|
Selected Financial Data
|
21
|
| |
|
|
|
Item 7.
|
Management's Discussion and Analysis of Financial Condition and Results of Operations
|
22
|
| |
|
|
|
Item 7A.
|
Quantitative and Qualitative Disclosures About Market Risk
|
34
|
| |
|
|
|
Item 8.
|
Financial Statements and Supplementary Data
|
35
|
| |
|
|
|
Item 9.
|
Changes in and Disagreements with Accountants on Accounting and Financial Disclosure
|
66
|
| |
|
|
|
Item 9A.
|
Controls and Procedures
|
66
|
| |
|
|
|
Item 9B.
|
Other Information
|
66
|
| |
|
|
|
PART III
|
|
|
| |
|
|
|
Item 10.
|
Directors, Executive Officers and Corporate Governance
|
67
|
| |
|
|
|
Item 11.
|
Executive Compensation
|
67
|
| |
|
|
|
Item 12.
|
Security Ownership of Certain Beneficial Owners and Management and Related Stockholder Matters |
67 |
| |
|
|
|
Item 13.
|
Certain Relationships and Related Transactions, and Director Independence
|
68
|
| |
|
|
|
Item 14.
|
Principal Accounting Fees and Services
|
68
|
| |
|
|
|
PART IV
|
|
|
| |
|
|
|
Item 15.
|
Exhibits, Financial Statement Schedules
|
68
|
| |
|
|
|
Item 16.
|
Form 10-K Summary
|
71 |
| |
|
|
|
SIGNATURES
|
72 |
ETHAN ALLEN INTERIORS INC. AND SUBSIDIARIES
CAUTIONARY NOTE REGARDING FORWARD-LOOKING STATEMENTS (SAFE-HARBOR)
This Annual Report on Form 10-K contains certain statements which may constitute “forward-looking statements” within the meaning of Section 27A of the Securities Act of 1933 and Section 21E of the Securities Exchange Act of 1934. Generally, forward-looking statements give current expectations and projections relating to financial condition, results of operations, plans, objectives, future performance and business. A reader can identify forward-looking statements by the fact that they do not relate strictly to historical or current facts. These statements may include words such as “anticipate,” “estimate,” “expect,” “project,” “plan,” “intend,” “believe,” “continue,” “may,” “will,” “short-term,” “target,” “outlook,” “forecast,” “guidance,” “non-recurring,” “one-time,” “unusual,” “should,” “likely” and other words and terms of similar meaning in connection with any discussion of the timing or nature of future operating or financial performance or other events.
Forward-looking statements are subject to risks and uncertainties that may cause actual results to differ materially from those that are expected. Ethan Allen Interiors Inc. and its subsidiaries (the “Company”) derive many of its forward-looking statements from operating budgets and forecasts, which are based upon many detailed assumptions. While the Company believes that its assumptions are reasonable, it cautions that it is very difficult to predict the impact of known factors and it is impossible for the Company to anticipate all factors that could affect actual results and matters that are identified as “short term,” “non-recurring,” “unusual,” “one-time,” or other words and terms of similar meaning may in fact recur in one or more future financial reporting periods. Important factors that could cause actual results to differ materially from the Company’s expectations, or cautionary statements, are disclosed in Item 1A, Risk Factors, Item 7, Management’s Discussion and Analysis of Financial Condition and Results of Operations, and elsewhere in this Annual Report Form 10-K. All forward-looking statements attributable to the Company, or persons acting on its behalf, are expressly qualified in their entirety by these cautionary statements, as well as other cautionary statements. A reader should evaluate all forward-looking statements made in this Annual Report on Form 10-K in the context of these risks and uncertainties. Given the risks and uncertainties surrounding forward-looking statements, you should not place undue reliance on these statements. Many of these factors are beyond our ability to control or predict.
The forward-looking statements included in this Annual Report on Form 10-K are made only as of the date hereof. The Company undertakes no obligation to publicly update or revise any forward-looking statement, whether as a result of new information, future events or otherwise, except as otherwise required by law.
ETHAN ALLEN INTERIORS INC. AND SUBSIDIARIES
PART I
ITEM 1. BUSINESS
Overview
Founded in 1932 and incorporated in Delaware in 1989, Ethan Allen Interiors Inc., through its wholly-owned subsidiary, Ethan Allen Global, Inc., and Ethan Allen Global, Inc.’s subsidiaries (collectively, “we,” “us,” “our,” “Ethan Allen” or the “Company”), is a leading interior design company, manufacturer and retailer in the home furnishings marketplace. Today we are a global luxury international home fashion brand that is vertically integrated from design through delivery, which affords our clientele a value proposition of style, quality and price. We provide complimentary interior design service to our customers and sell a full range of furniture products and decorative accents through a retail network of approximately 300 design centers in the United States and abroad as well as online at ethanallen.com. The design centers represent a mix of independent licensees and Company-owned and operated locations. We own and operate six manufacturing facilities, including three manufacturing plants and one sawmill in the United States and one upholstery manufacturing plant in Mexico and one case goods manufacturing plant in Honduras.
Business Strategy
Our strategy has been to position Ethan Allen as a preferred brand offering complimentary design service together with products of superior style, quality and value to provide consumers with a comprehensive, one-stop shopping solution for their home furnishing and interior design needs. In carrying out our strategy, we continue to expand our reach to a broader consumer base through a diverse selection of attractively priced products, designed to complement one another, reflecting current fashion trends in home decorating. We continuously monitor changes in home fashion trends through attendance at international industry events and fashion shows, internal market research, and regular communication with our retailers and design center design consultants who provide valuable input on consumer trends. We believe that the observations and input gathered enable us to incorporate appropriate style details into our products to react quickly to changing consumer tastes.
Product
The majority of the products we sell are built by artisans in our North American plants. Most upholstery frames are hand-assembled and stitching is guided by hand. We select international partners who are as committed to quality and social responsibility as we are. All case goods frames are made with premium lumber and veneers. We use best-in-class construction techniques, including mortise and tenon joinery and four-corner glued dovetail joinery on drawers. We combine technology with personal service and maintain an up-to-date broad range of styles and custom options in keeping with today’s home decorating trends. These factors continue to define Ethan Allen, positioning us as a fashion leader in the home furnishing industry.
The interior of our design centers, which have been substantially refreshed during the past three fiscal years, are organized to facilitate display of our product offerings, both in room settings that project the category lifestyle and by product grouping to facilitate comparisons of the styles and tastes of our customers. To further enhance the experience, technology is used to expand the range of products viewed by including content from our website and 3-D digital images in applications used on large touch-screen flat panel displays.
Product Development
Using a combination of employees and designers, we design the majority of the products we sell. All of our products are Ethan Allen branded. This important facet of our vertically integrated business enables us to control the design specifications and establish consistent levels of quality across all our product programs. In addition to our four United States manufacturing facilities, we have an upholstery manufacturing facility in Mexico and a case goods manufacturing facility in Honduras. Approximately 75% of our products are manufactured or assembled in these North American facilities. We selectively outsource the remaining 25% of our products, primarily from Asia. We carefully select our sourcing partners and require strict compliance with our specifications and quality standards. We believe that strategic investments in our manufacturing facilities balanced with outsourcing from foreign and domestic suppliers would enable us to accommodate any significant future sales growth and allow us to maintain an appropriate degree of control over cost, quality and service to our customers.
Raw Materials and Other Suppliers
The most important raw materials we use in furniture manufacturing are lumber, veneers, plywood, hardware, glue, finishing materials, glass, laminates, steel, fabrics, foam, and filling material. The various types of wood used in our products include cherry, ash, oak, maple, prima vera, African mahogany, birch, rubber wood and poplar.
ETHAN ALLEN INTERIORS INC. AND SUBSIDIARIES
Fabrics and other raw materials are purchased both domestically and outside the United States . We have no significant long-term supply contracts, and have sufficient alternate sources of supply to prevent disruption in supplying our operations. We maintain a number of sources for our raw materials, which we believe contribute to our ability to obtain competitive pricing. Lumber prices and availability fluctuate over time based on factors such as weather and demand. The cost of some of our raw materials such as foam and shipping costs are dependent on petroleum cost. Higher material prices, cost of petroleum, and costs of sourced products could have an adverse effect on margins.
Appropriate amounts of lumber and fabric inventory are typically stocked to maintain adequate production levels. We believe that our sources of supply for these materials are sufficient and that we are not dependent on any one supplier.
We enter into standard purchase agreements with foreign and domestic suppliers to source selected products. The terms of these arrangements are customary for the industry and do not contain any long-term contractual obligations on our behalf. We believe we maintain good relationships with our suppliers.
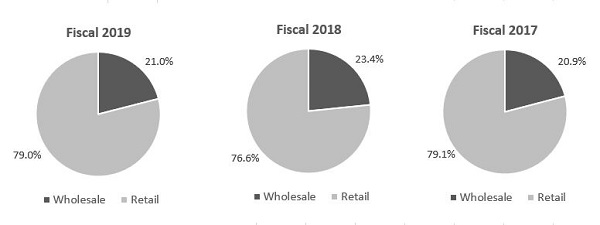
Segments
We have strategically aligned our business into two reportable segments: Wholesale and Retail. These two segments represent strategic business areas of our vertically integrated enterprise that operate separately and provide their own distinctive services. This vertical structure enables us to offer our complete line of home furnishings and accents while controlling quality and cost. We evaluate performance of the respective segments based upon net sales and operating income. Inter-segment transactions result, primarily, from the wholesale sale of inventory to the retail segment, including the related profit margin. Financial information, including sales, operating income and long-lived assets related to our segments are disclosed in Note 19, Segment Information, of the notes to our consolidated financial statements included under Item 8 of this Annual Report on Form 10-K.
As of June 30, 2019, the Company operated 144 design centers (our retail segment) and our independent retailers operated 158 design centers. Our wholesale segment net sales include sales to our retail segment, which are eliminated in consolidation, sales to our independent retailers and unaffiliated third parties.
The following charts depict net sales related to our reportable segments.
We believe that the demand for furniture generally reflects sensitivity to overall economic conditions, including consumer confidence, housing market conditions and unemployment rates. For both our segments, the second and fourth quarters are historically the seasonally highest-volume sales quarters. However, during fiscal 2019, we experienced our largest sales volume quarter for our wholesale business during the first quarter while our retail segment had its highest sales volume during the second quarter. We believe this fiscal 2019 experience was not an indicator that our seasonal trends are changing.
Retail Segment
The retail segment, which accounted for 79% of net sales during fiscal 2019, sells home furnishings and accents to consumers through a network of Company operated design centers. Retail revenue is generated upon the retail sale and delivery of our products to our retail customers through our network of service centers. Retail profitability reflects (i) the retail gross margin, which represents the difference between the retail net sales price and the cost of goods, purchased primarily from the wholesale segment, and (ii) other operating costs associated with retail segment activities.
We measure the performance of our design centers based on net sales and written orders booked on a comparable period basis. Comparable design centers are those which have been operating for at least 15 months, including relocated design centers provided the original and relocated design center location had been operating for at least 15 months on a combined basis. During the first three months of operations of newly opened design centers, written orders are booked but minimal net sales are achieved through the delivery of products. Design centers we acquire from independent retailers are included in comparable design center sales in their 13th full month of Ethan Allen-owned operations. The frequency of our promotional events as well as the timing of the end of those events can also affect the comparability of orders booked during a given period. Due to the nature of the business in which the retail segment operates, there are no customer concentration risks.
ETHAN ALLEN INTERIORS INC. AND SUBSIDIARIES
The retail segment’s product line revenue, expressed as a percentage of net sales, is comprised of approximately 48% in upholstered products, 30% case goods and the remaining 22% in home accents and other.
During fiscal 2019, we acquired two new design centers in the United States from independent retailers and closed six locations, which is net of three relocations. The geographic distribution of retail design center locations is disclosed under Item 2, Properties, contained in Part I of this Annual Report on Form 10-K.
Wholesale Segment
The wholesale segment, which accounted for 21% of net sales during fiscal 2019, is principally involved in the development of the Ethan Allen brand and encompasses all aspects of design, manufacture, sourcing, marketing, sale and distribution of our broad range of home furnishings and accents. Wholesale revenue is generated upon the sale and shipment of our products to our retail network of independently operated design centers, Company operated design centers and other contract customers. Sales to ten of our largest customers accounted for 21% of revenues within our wholesale segment during fiscal 2019.
Within the wholesale segment, we maintain revenue information according to each respective product line (i.e. case goods, upholstery, and home accents). Case goods include items such as beds, dressers, armoires, tables, chairs, buffets, entertainment units, home office furniture, and wooden accents. Upholstery items include sleepers, recliners and other motion furniture, chairs, ottomans, custom pillows, sofas, loveseats, cut fabrics and leather. Skilled artisans cut, sew and upholster custom-designed upholstery items which are available in a variety of frame, fabric and trim options. Home accent items include window treatments and drapery hardware, wall decor, florals, lighting, clocks, mattresses, bedspreads, throws, pillows, decorative accents, area rugs, wall coverings and home and garden furnishings.
Wholesale profitability includes (i) the wholesale gross margin, which represents the difference between the wholesale net sales price and the cost associated with manufacturing and/or sourcing the related product, and (ii) other operating costs associated with wholesale segment activities.
The wholesale segment’s product line revenue, expressed as a percentage of net sales, is comprised of approximately 50% in upholstered products, 33% case goods and the remaining 17% in home accents and other.
As of June 30, 2019, our wholesale backlog was $46.4 million (as compared to $56.5 million as of June 30, 2018) which is anticipated to be serviced in the first quarter of fiscal 2020. Our backlog was down 18.0% as our manufacturing operations returned to normal throughput as compared to the prior year’s longer production lead-times primarily related to the GSA contract startup. Our wholesale backlog fluctuates based on the timing of net orders booked, manufacturing schedules and efficiency, the timing of sourced product receipts, the timing and volume of wholesale shipments, and the timing of various promotional events. Because orders may be rescheduled and/or canceled and the sourcing timing may change, the measure of backlog at a point in time is not necessarily indicative of future sales performance.
Our independent retailers are required to enter into license agreements with us, which (i) authorize the use of certain Ethan Allen trademarks and (ii) require adherence to certain standards of operation, including a requirement to fulfill related warranty service agreements. We are not subject to any territorial or exclusive retailer agreements in North America.
The geographic distribution of manufacturing and distribution locations is disclosed under Item 2, Properties, contained in Part I of this Annual Report on Form 10-K.
Talent
Since our founding, we have built a collaborative culture that recognizes and rewards innovation and offers employees a variety of opportunities and experiences. Our employees are critical to our success and are one of the main reasons we continue to execute at a high level. We believe our continued focus on making employee engagement a top priority will help us provide high quality products and services to our customers.
At June 30, 2019 our employee count totaled 4,700, a decrease from 5,200 a year ago, which reflects the impact of restructuring actions taken to further optimize our manufacturing and logistics operations. The majority of our employees are employed on a full time basis and we believe we maintain good relationships with our employees. None of our employees are represented by unions or collective bargaining agreements.
ETHAN ALLEN INTERIORS INC. AND SUBSIDIARIES
Customer Service Offerings
We offer numerous customer service programs, each of which has been developed and introduced to consumers in an effort to make their shopping experience easier and more enjoyable.
Gift Card. This program allows customers to purchase and redeem gift cards through our website or at any participating retail design center, which can be used for any of our products or services.
Ethan Allen Consumer Credit. The Ethan Allen Platinum consumer credit program offers customers a menu of custom financing options. Financing offered through this program is administered by a third-party financial institution and is granted to our customers on a non-recourse basis to the Company. Customers may apply for an Ethan Allen Platinum card at any participating design center or online at ethanallen.com.
Marketing
Rooted in the five pillars of our brand – diversity of style, quality and craftsmanship, sustainability, complimentary design service, and premier in-home delivery – Ethan Allen’s marketing programs are designed to drive traffic to our retail network of approximately 300 design centers as well as to our e-commerce and social sites.
Our marketing approach begins with a customer experience that exemplifies the Ethan Allen difference. Through interactions in the design center, monitoring and response to online reviews and social channels, and surveys, we work to incorporate the voices of our customers into every decision we make. By deploying customer relationship management tools, we are further segmenting our target markets, creating a more personalized shopping experience and developing more personalized content than ever before.
Our new Ethan Allen Platinum consumer credit program, designed to make the Ethan Allen brand accessible to everyone, had a successful national launch and should continue to attract both new prospects and returning customers.
Through both paid and owned channels, we continue to position Ethan Allen as an aspirational yet approachable brand. We deliver these messages in a variety of ways – locally, nationally, and globally – to connect and engage with our target audience and drive sales. Direct mail continues to be a critical marketing medium for us. Our magazine, distributed to almost 22 million households, enables customers and prospects to immerse themselves in inspirational photos of our products; it is also a frequent starting point for conversations with our designers. We strive to be present at natural connection points with customers, using targeted direct mail pieces like our new mover's brochure. Along with our magazine, each direct mail piece is distributed to a targeted marketing segment based on data collected internally and through independent market research.
In addition to newspapers and shelter magazines, local efforts complement and strengthen our national marketing strategy with many markets increasing their reach through targeted broadcast, streaming radio, local digital and robust social initiatives.
As online shopping takes on increasing importance, we have continued to improve both user experience and conversion optimization on ethanallen.com and ethanallen.ca. We invest in both paid and organic search engine marketing, and we work to improve the local search rankings of each design center location. We have also continued to improve our programs for collecting user-generated content, both from customers and designers, which showcases the way our customers are living with Ethan Allen. Our new EA InHomeTM mobile app, which utilizes augmented reality, gives customers the ability to preview products in their space before they make a purchase; our 3-D room planner, available in design centers, offers an even more immersive experience and helps move customers toward conversion.
Significant growth in our organic social following, including a 25% increase in Instagram followers during the 2018 calendar year, and paid social campaigns help bring awareness of the Ethan Allen brand to every demographic. We utilize these channels to build a sense of community, and by extension brand loyalty, among our current and prospective customers.
Competition
We believe the home furnishings industry competes primarily on the basis of product styling and quality, personal service, prompt delivery, product availability and price. We further believe that we effectively compete on the basis of each of these factors and that, more specifically under our vertical structure, our complimentary interior design service, direct manufacturing, white glove delivery service, product presentations, and website create a competitive advantage, further supporting our mission of providing consumers with a complete home decorating and design solution. We also believe that we differentiate ourselves further with the quality of our interior design service through our intensive training and the caliber of our design consultants. Our objective is to continue to develop and strengthen our retail network by (i) expanding the Company operated retail business through the repositioning and opening of new design centers, (ii) obtaining and retaining independent retailers, encouraging such retailers to expand their business through the opening or relocation of new design centers with the objective of increasing the volume of their sales, (iii) further expanding our sales network through our independent design associates and realtor referral programs, and (iv) further expanding our ecommerce.
ETHAN ALLEN INTERIORS INC. AND SUBSIDIARIES
At Ethan Allen, our internet strategy is to drive traffic into our design centers by combining technology with excellent personal service. Though our customers have the opportunity to buy our products online, we take the process further. With so much of our product customizable, we encourage our website customers to get personal help from our interior design professionals either in person or by chatting online with one of our qualified design consultants. This complimentary direct contact with one of our knowledgeable interior designers creates a competitive advantage through our excellent personal service. This enhances the online experience and regularly leads to internet customers becoming customers of our network of interior design centers.
Retail Design Centers
We continue to strengthen the Ethen Allen brand with many initiatives, including the opening of new design centers and relocating or consolidating certain existing design and service centers, regularly updating presentations and floor plans, and strengthening of the qualifications of our designers through training and certification.
Ethan Allen design centers are typically located in busy retail settings as freestanding destinations or as part of town centers, lifestyle centers, suburban strip malls or shopping malls, depending upon the real estate opportunities in a particular market. Our 144 Company operated retail design centers average approximately 15,300 square feet in size with 63% of them ranging between 10,000 and 20,000 square feet, while 21% being less than 10,000 square feet and the remaining 16% being greater than 20,000 square feet. During the past 10 years, 37% of our design centers are new or have been relocated.
Combining technology with personal service in our design centers has allowed us to reduce the size of our design centers. In the past five years, we have either opened or relocated a total of 24 new design centers that have an average size of approximately 9,000 square feet. These smaller footprint design centers reflect our direction as we move forward in repositioning our retail design centers. These new and relocated design centers also reflect our shift from destination and shopping mall locations to lifestyle centers that better project our brand and offer increased traffic opportunities.
We strive to maintain consistency of presentation throughout our retail design centers through a comprehensive set of standards and display planning assistance. These interior display design standards enable each design center to present a high quality image by using focused lifestyle settings and select product category groupings to display our products and information to facilitate design solutions and to educate consumers. We also create a consistent brand projection through our exterior facades and signage.
Distribution and Logistics
We distribute our products through four distribution centers, owned by the Company, strategically located in North Carolina, Oklahoma, and Virginia. These distribution centers provide efficient cross-dock operations to receive and ship product from our manufacturing facilities and third-party suppliers to our retail network of Company and independently operated retail service centers. Retail service centers prepare products for delivery into customers’ homes. At June 30, 2019, our Company operated retail design centers were supported by 13 Company operated retail service centers and 14 service centers operated by third parties.
While we manufacture to custom order the majority of our products, we also stock certain case goods, upholstery and home accents to provide for quick delivery of in-stock items and to allow for more efficient production runs. We utilize independent carriers to ship our products.
Our practice has been to sell our products at the same delivered cost to all Company and independently operated design centers throughout the United States, regardless of their shipping point. This policy creates pricing credibility with our wholesale customers while providing our retail segment the opportunity to achieve more consistent margins by removing fluctuations attributable to the cost of shipping. Further, this policy eliminates the need for our independent retailers to carry significant amounts of inventory in their own warehouses. As a result, we obtain more accurate consumer product demand information.
ETHAN ALLEN INTERIORS INC. AND SUBSIDIARIES
Environmental Sustainability and Social Responsibility
We continue to be focused on environmental and social responsibility while incorporating uniform social, environmental, health and safety programs into our global manufacturing standards.
Our environmental (green) initiatives include but are not limited to the use of responsibly harvested Appalachian woods, and water-based finishes and measuring our carbon footprint, greenhouse gases and recycled materials from our operations. We have eliminated the use of heavy metals and hydrochlorofluorocarbons in all packaging. Our mattresses and custom upholstery use foam made without harmful chemicals and substances. We have implemented the Enhancing Furniture’s Environmental Culture (“EFEC”) environmental management system sponsored by the American Home Furnishing Alliance (“AHFA”) at all our domestic manufacturing, distribution and service center facilities, and have expanded these efforts to our retail design centers, which have now been registered in EFEC. Our Mexico and Honduras facilities are also registered under the AHFA's EFEC program. Our United States manufacturing, distribution and service centers have also achieved Sustainable by Design (“SBD”) registration status under the EFEC program. SBD provides a framework for home furnishings companies to create and maintain a corporate culture of conservation and environmental stewardship by integrating socio-economic policies and sustainable business practices into their manufacturing operations and sourcing strategies.
The Company requires its sourcing facilities that manufacture Ethan Allen branded products to implement a labor compliance program and meet or exceed the standards established for preventing child labor, involuntary labor, coercion and harassment, discrimination, and restrictions to freedom of association. These facilities are also required to provide a safe and healthy environment in all workspaces, compliance with all local wage and hour laws and regulations, compliance with all applicable environmental laws and regulations, and are required to authorize Ethan Allen or its designated agents (including third-party auditing companies) to engage in monitoring activities to confirm compliance.
We work to ensure our products are safe in our customers’ homes through responsible use of chemicals and manufacturing substances.
Intellectual Property
We currently hold, or have registration applications pending for, numerous trademarks, service marks and copyrights for the Ethan Allen name, logos and designs in a broad range of classes for both products and services in the United States and in many foreign countries. In addition, we have registered, or have applications pending for certain of our slogans utilized in connection with promoting brand awareness, retail sales and other services and certain collection names. We view such trademarks and service marks as valuable assets and have an ongoing program to diligently monitor and defend, through appropriate action, against their unauthorized use.
Government Regulation
The Company is subject to reporting requirements, disclosure obligations and other recordkeeping requirements of the Securities and Exchange Commission (“SEC”) and the various local authorities that regulate each location in which we operate.
Corporate Contact Information
Ethan Allen’s principal executive office is in Danbury, Connecticut.
| |
●
|
Mailing address of the Company’s headquarters: 25 Lake Avenue Ext., Danbury, Connecticut 06811
|
| |
●
|
Telephone number: +1 (203) 743-8000
|
| |
●
|
Website address: ethanallen.com
|
Available Information
Information contained in our Investor Relations section of our website at ethanallen.com/investors is not part of this Annual Report on Form 10-K. Information that we furnish or file with the SEC, including our Annual Reports on Form 10-K, Quarterly Reports on Form 10-Q, Current Reports on Form 8-K or exhibits included in these reports are available for download, free of charge, on our website soon after such reports are filed with or furnished to the SEC. Our SEC filings, including exhibits filed therewith, are available on the SEC’s website at sec.gov.
ETHAN ALLEN INTERIORS INC. AND SUBSIDIARIES
Information about our Executive Officers
Listed below are the name, age, and current position for each of our executive officers as of the date of this Annual Report on Form 10-K. If they have not held the positions for at least five years, their former positions during that period are listed.
|
M. Farooq Kathwari*, age 74
● Chairman of the Board, President and Chief Executive Officer since 1988
|
| |
|
Daniel M. Grow, age 73
● Senior Vice President, Business Development since February 2015
● Vice President, Business Development from 2009 to 2015
|
| |
|
Eric D. Koster, age 72
● Vice President, General Counsel and Secretary since April 2013
● Private practice prior to joining the Company in April 2013
|
| |
|
Christopher Robertson, age 50
● Vice President, Logistics and Service since January 2016
● Director, Operations Support since May 2011
|
| |
|
Clifford Thorn, age 67
● Vice President, Upholstery Manufacturing since May 2001
|
| |
|
Corey Whitely, age 59
● Executive Vice President, Administration, Chief Financial Officer and Treasurer since July 2014
● Executive Vice President, Operations from October 2007 through July 2014
|
| |
|
Michael Worth, age 52
● Vice President, Case Goods Manufacturing since December 2016
● Regional Operations Manager, Case Goods since February 2004
|
* Mr. Kathwari is the only one of our executive officers who operates under a written employment agreement.
Additional Information
Additional information with respect to the Company’s business is included in the following pages and is incorporated herein by reference:
| |
Page
|
|
Five-Year Summary of Selected Financial Data
|
21
|
|
Management’s Discussion and Analysis of Financial Condition and Results of Operations
|
22
|
|
Quantitative and Qualitative Disclosures about Market Risk
|
34
|
|
Note 1 to Consolidated Financial Statements entitled Organization and Nature of Business
|
43
|
|
Note 19 to Consolidated Financial Statements entitled Segment Information
|
61
|
ETHAN ALLEN INTERIORS INC. AND SUBSIDIARIES
ITEM 1A. RISK FACTORS
The following risks could materially and adversely affect our business, financial condition, cash flows, results of operations and the trading price of our common stock could decline. These risk factors do not identify all risks that we face; our operations could also be affected by factors that are not presently known to us or that we currently consider to be immaterial to our operations. Investors should also refer to the other information set forth in this Annual Report on Form 10-K, including Management’s Discussion and Analysis of Financial Condition and Results of Operations and our financial statements including the related notes. Investors should carefully consider all risks, including those disclosed, before making an investment decision.
A volatile retail environment and changing economic conditions may further adversely affect consumer demand and spending.
General economic factors that are beyond the Company’s control could impact our forecasts and actual performance. These factors include housing markets, recession, inflation, deflation, consumer credit availability, consumer debt levels, fuel and energy costs, interest rates, tax rates and policy, unemployment trends, the impact of natural disasters, civil disturbances and terrorist activities, foreign currency exchange rate fluctuations, conditions affecting the retail environment for products sold by the Company and other matters that influence consumer spending. Changes in the economic climate could adversely affect the Company’s performance.
Historically, the home furnishings industry has been subject to cyclical variations in the general economy and to uncertainty regarding future economic prospects. Should the current economic recovery falter or the current recovery in housing starts to stall, consumer confidence and demand for home furnishings could deteriorate, which could adversely affect our business through its impact on the performance of our Company-owned design centers, as well as on our independent licensees and the ability of a number of them to meet their obligations to us.
Our business and results of operations are affected by international, national and regional economic conditions. Regional economic conditions in the United States and in other regions of the world where we have a concentration of design centers such as Canada or China, may have a greater impact on the Company compared to economic conditions in other parts of the world where we have lesser concentration of design centers. An economic downturn of significance or extended duration could adversely affect consumer demand and discretionary spending habits and, as a result, our business performance, profitability, and cash flows. Our international net sales accounted for 6.8% of our consolidated net sales during fiscal 2019.
Global and local economic uncertainty may materially adversely affect our manufacturing operations or sources of merchandise and international operations.
The current economic challenges in China, including global economic ramifications of the softening of the Chinese economy and trade agreement negotiations, may continue to put pressure on global economic conditions. This economic uncertainty, as well as other variations in global economic conditions such as fuel costs, wage and benefit inflation, and currency fluctuations, may cause inconsistent and unpredictable consumer spending habits, while increasing our own input costs. These risks resulting from global and local economic uncertainty could also severely disrupt our manufacturing operations, which could have a material adverse affect on our financial performance. We import a portion of our merchandise from foreign countries and operate manufacturing plants in Mexico and Honduras and retail design centers in Canada. As a result, our ability to obtain adequate supplies or to control our costs may be adversely affected by events affecting international commerce and businesses located outside the United States, including natural disasters, changes in international trade including tariffs, central bank actions, changes in the relationship of the United States dollar versus other currencies, labor availability and cost, and other governmental policies of the United States and the countries from which we import our merchandise or in which we operate facilities.
Disruptions of our supply chain could have a material adverse affect on our operating and financial results.
Disruption of the Company’s supply chain capabilities due to trade restrictions, political instability, weather, natural disaster, terrorism, product recalls, labor supply or stoppages, the financial and/or operational instability of key suppliers and carriers, or other reasons could impair the Company’s ability to distribute its products. To the extent we are unable to mitigate the likelihood or potential impact of such events, there could be a material adverse affect on our operating and financial results.
ETHAN ALLEN INTERIORS INC. AND SUBSIDIARIES
Changes in United States trade and tax policy could materially adversely affect our business and results of operations.
Changes in the political environment in the United States may require us to modify our current business practices. Because we manufacture components and finished goods in Mexico and Honduras and purchase components and finished goods manufactured in foreign countries, including China, we are subject to risks relating to increased tariffs on United States imports, changes in the North American Free Trade Agreement, and other changes affecting imports. Recently, the United States administration considered enacting certain tariffs on many items sourced from China, including certain furniture, accessories, furniture parts, and raw materials that are imported into the United States and used in our domestic operations. We may not be able to fully or substantially mitigate the impact of such tariffs, pass price increases on to our customers, or secure adequate alternative sources of products or materials. The tariffs, along with any additional tariffs or retaliatory trade restrictions implemented by other countries, could negatively impact customer sales, including potential delays in product received from our vendors, our cost of goods sold and results of operations.
Approximately 25% of our merchandise is sourced from outside of the United States. The United States government is considering proposals for substantial changes to its trade and tax policies, which could include import restrictions, increased import tariffs, changes to or withdrawal from existing trade agreements, and border-adjustment taxes among other possible measures. Material changes in these policies could increase our tax obligations or require us to increase prices to customers, which would likely adversely affect sales. Any significant change in United States policy related to imported merchandise could have a material adverse affect on our business and financial results.
Competition from overseas manufacturers and domestic retailers may adversely materially affect our business, operating results or financial condition.
Our wholesale business segment is involved in the development of our brand, which encompasses the design, manufacture, sourcing, sales and distribution of our home furnishings products, and competes with other United States and foreign manufacturers. Our retail network sells home furnishings to consumers through a network of independently operated and Company operated design centers, and competes against a diverse group of retailers ranging from specialty stores to traditional furniture and department stores, any of which may operate locally, regionally, nationally or globally, as well as over the internet. We also compete with these and other retailers for retail locations as well as for qualified design consultants and management personnel. Such competition could adversely affect our future financial performance.
Industry globalization has led to increased competitive pressures brought about by the increasing volume of imported finished goods and components, particularly for case good products, and the development of manufacturing capabilities in other countries, specifically within Asia. The increase in overseas production has created over‐capacity for many manufacturers, including us, which has led to industry‐wide plant consolidation. In addition, because many foreign manufacturers are able to maintain substantially lower production costs, including the cost of labor and overhead, imported product may be capable of being sold at a lower price to consumers, which, in turn, could lead to some measure of further industry‐wide price deflation.
We cannot provide assurance that we will be able to establish or maintain relationships with sufficient or appropriate manufacturers, whether foreign or domestic, to supply us with selected case goods, upholstery and home accent items to enable us to maintain our competitive advantage. In addition, the emergence of foreign manufacturers has served to broaden the competitive landscape. Some of these competitors produce furniture types not manufactured by us and may have greater financial resources available to them or lower costs of operating. This competition could materially adversely affect our future financial performance.
Failure to successfully anticipate or respond to changes in consumer tastes and trends in a timely manner could materially adversely impact our business, operating results and financial condition.
Sales of our products are dependent upon consumer acceptance of our product designs, styles, quality and price. We continuously monitor changes in home design trends through attendance at international industry events and fashion shows, internal marketing research, and regular communication with our retailers and design consultants who provide valuable input on consumer tendencies. However, as with all retailers, our business is susceptible to changes in consumer tastes and trends. Such tastes and trends can change rapidly and any delay or failure to anticipate or respond to changing consumer tastes and trends in a timely manner could materially adversely impact our business, operating results and financial condition.
Inability to maintain and enhance our brand may materially adversely impact our business.
Maintaining and enhancing our brand is critical to our ability to expand our base of customers and may require us to make substantial investments. Our advertising campaign utilizes television, direct mail, digital, newspapers, magazines and radio to maintain and enhance our existing brand equity. We cannot provide assurance that our marketing, advertising and other efforts to promote and maintain awareness of our brand will not require us to incur substantial costs. If these efforts are unsuccessful or we incur substantial costs in connection with these efforts, our business, operating results and financial condition could be materially adversely affected.
ETHAN ALLEN INTERIORS INC. AND SUBSIDIARIES
Our number of manufacturing and logistics sites may increase our exposure to business disruptions and could result in higher transportation costs.
We have a limited number of manufacturing sites in our case goods and upholstery operations and consolidated our distribution network into fewer centers for both wholesale and retail segments. Our upholstery operations consist of two upholstery plants at our North Carolina campus and one plant in Mexico. The Company operates two manufacturing plants (Vermont and Honduras) and one sawmill in support of our case goods operations. As a result of the consolidation of our manufacturing operations into fewer facilities, if any of our manufacturing or logistics sites experience significant business interruption, our ability to manufacture or deliver our products in a timely manner would likely be impacted. While we have long‐standing relationships with multiple outside suppliers of our raw materials and commodities, there can be no assurance of their ability to fulfill our supply needs on a timely basis. The consolidation to fewer locations has resulted in longer distances for delivery and could result in higher costs to transport products if fuel costs increase significantly.
Fluctuations in the price, availability and quality of raw materials could result in increased costs or cause production delays which might result in a decline in sales, either of which could materially adversely impact our earnings.
We use various types of wood, foam, fibers, fabrics, leathers, and other raw materials in manufacturing our furniture. Certain of our raw materials, including fabrics, are purchased domestically as well as outside North America. Fluctuations in the price, availability and quality of raw materials could result in increased costs or a delay in manufacturing our products, which in turn could result in a delay in delivering products to our customers. For example, lumber prices fluctuate over time based on factors such as weather and demand, which, in turn, impact availability. Production delays or upward trends in raw material prices could result in lower sales or margins, thereby materially adversely impacting our earnings.
In addition, certain suppliers may require extensive advance notice of our requirements in order to produce products in the quantities we desire. This long lead time may require us to place orders far in advance of the time when certain products will be offered for sale, thereby exposing us to risks relating to shifts in consumer demand and trends, and any significant downturn in the United States economy.
Our current and former manufacturing and retail operations and products are subject to increasingly stringent environmental, health and safety requirements.
We use and generate hazardous substances in our manufacturing and retail operations. In addition, both the manufacturing properties on which we currently operate and those on which we have ceased operations are and have been used for industrial purposes. Our manufacturing operations and, to a lesser extent, our retail operations involve risk of personal injury or death. We are subject to increasingly stringent environmental, health and safety laws and regulations relating to our products, current and former properties and our current operations. These laws and regulations provide for substantial fines and criminal sanctions for violations and sometimes require product recalls and/or redesign, the installation of costly pollution control or safety equipment, or costly changes in operations to limit pollution or decrease the likelihood of injuries. In addition, we may become subject to potentially material liabilities for the investigation and cleanup of contaminated properties and to claims alleging personal injury or property damage resulting from exposure to or releases of hazardous substances or personal injury because of an unsafe workplace.
In addition, noncompliance with, or stricter enforcement of, existing laws and regulations, adoption of more stringent new laws and regulations, discovery of previously unknown contamination or imposition of new or increased requirements could require us to incur costs or become the basis of new or increased liabilities that could be material.
We operate in the highly competitive retail business where the use of emerging technologies as well as unanticipated changes in the pricing and other practices of competitors may adversely affect our performance.
The retail business is highly competitive. We compete for customers, employees, locations, merchandise, technology, services and other important aspects of the business with many other local, regional and national retailers. Those competitors range from specialty retailers to department stores and discounters as well as online and multichannel retailers. Specifically, rapidly evolving technologies are altering the manner in which the Company and its competitors communicate and transact with customers. Our strategy designed to adapt to these changes, in the context of competitors’ actions, customers adoption of new technology, and related changes in customer behavior, presents a specific risk in the event we are unable to successfully execute our plans or adjust them over time if needed. Further, unanticipated changes in pricing and other practices of competitors, including promotional activity, such as thresholds for free shipping and rapid price fluctuation enabled by technology, may adversely affect our performance.
ETHAN ALLEN INTERIORS INC. AND SUBSIDIARIES
We rely extensively on information technology systems to process transactions, summarize results, and manage our business and that of certain independent retailers. Disruptions in both our primary and back-up systems could adversely affect our business and operating results.
Our primary and back-up information technology systems are subject to damage or interruption from power outages, computer and telecommunications failures, viruses, phishing attempts, cyber-attacks, malware and ransomware attacks, security breaches, natural disasters, and errors by employees. Though losses arising from some of these issues would be covered by insurance, interruptions of our critical business information technology systems or failure of our back-up systems could result in longer production times or negatively impact customers resulting in damage to our reputation and a reduction in sales. If our critical information technology systems or back-up systems were damaged or ceased to function properly, we might have to make a significant investment to repair or replace them.
Product recalls or product safety concerns could materially adversely affect our sales and operating results.
If the Company's merchandise offerings do not meet applicable safety standards or consumers' expectations regarding safety, the Company could experience decreased sales, increased costs and/or be exposed to legal and reputational risk. Events that give rise to actual, potential or perceived product safety concerns could expose the Company to government enforcement action and/or private litigation. Reputational damage caused by real or perceived product safety concerns or product recalls could negatively affect the Company's business and results of operations.
Successful cyber-attacks and the failure to maintain adequate cyber-security systems and procedures could harm materially our operations.
In the current environment, there are numerous and evolving risks to cybersecurity and privacy, including criminal hackers, hacktivists, state-sponsored intrusions, industrial espionage, employee malfeasance and human or technological error. High-profile security breaches at other companies and in government agencies have increased in recent years, and security industry experts and government officials have warned about the risks of hackers and cyberattacks targeting businesses such as ours. Cyber-attacks are becoming more sophisticated and frequent, and in some cases have caused significant harm. Computer hackers and others routinely attempt to breach the security of technology products, services and systems, and to fraudulently induce employees, customers, or others to disclose information or unwittingly provide access to systems or data. We operate many aspects of our business including financial reporting, and customer relationship management through server and web‐based technologies, and store various types of data on such servers or with third‐parties who in turn store it on servers and in the “cloud.” Any disruption to the internet or to the Company's or its service providers' global technology infrastructure, including malware, insecure coding, “Acts of God,” attempts to penetrate networks, data theft or loss and human error, could have adverse affects on the Company's operations. A cyber-attack of our systems or networks that impairs our information technology systems could disrupt our business operations and result in loss of service to customers. The risk of cyberattacks to our Company also includes attempted breaches of contractors, business partners, vendors and other third parties. We have a comprehensive cybersecurity program designed to protect and preserve the integrity of our information technology systems. We have experienced and expect to continue to experience actual or attempted cyber-attacks of our IT systems or networks; however, none of these actual or attempted cyber-attacks had a material impact on our operations or financial condition.
While we devote significant resources to network security, data encryption and other security measures to protect our systems and data, including our own proprietary information and the confidential and personally identifiable information of our customers, employees, and business partners, these measures cannot provide absolute security. The costs to eliminate or alleviate network security problems, bugs, viruses, worms, malicious software programs and security vulnerabilities could be significant, and our efforts to address these problems may not be successful, resulting potentially in the theft, loss, destruction or corruption of information we store electronically, as well as unexpected interruptions, delays or cessation of service, any of which could cause harm to our business operations. Moreover, if a computer security breach or cyber-attack affects our systems or results in the unauthorized release of proprietary or personally identifiable information, our reputation could be materially damaged, our customer confidence could be diminished, and our operations, including technical support for our devices, could be impaired. We would also be exposed to a risk of loss or litigation and potential liability, which could have a material adverse affect on our business, results of operations and financial condition.
ETHAN ALLEN INTERIORS INC. AND SUBSIDIARIES
Loss, corruption and misappropriation of data and information relating to customers could materially adversely affect our operations.
We have access to sensitive customer information in the ordinary course of business. If a significant data breach occurred, our reputation may be adversely affected, customer confidence may be diminished, or we may be subject to legal claims, or legal proceedings, including regulatory investigations and actions, may have a negative impact on our reputation, may lead to regulatory enforcement actions against us, and may materially adversely affect our business, operating results and financial condition. The loss, disclosure or misappropriation of our business information may materially adversely affect our business, operating results and financial condition. Further, legislative or regulatory action in these areas is evolving, and we may be unable to adapt our IT systems or to manage the IT systems of third parties to accommodate these changes. Finally, if a significant data breach occurred, our reputation could be materially and adversely affected, and confidence among our customers may be diminished.
Our business is dependent on certain key personnel; if we lose key personnel or are unable to hire additional qualified personnel, our business may be harmed.
The success of our business depends upon our ability to retain continued service of certain key personnel, particularly our Chairman of the Board, President and Chief Executive Officer, M. Farooq Kathwari, and to attract and retain additional qualified key personnel in the future. We face risks related to loss of any key personnel and we also face risks related to any changes that may occur in key senior leadership executive positions. Any disruption in the services of our key personnel could make it more difficult to successfully operate our business and achieve our business goals and could adversely affect our results of operation and financial condition. These changes could also increase the volatility of our stock price.
The market for qualified employees and personnel in the retail and manufacturing industries is highly competitive. Our success depends upon our ability to attract, retain and motivate qualified artisans, professional and clerical employees and upon the continued contributions of these individuals. We cannot provide assurance that we will be successful in attracting and retaining qualified personnel. A shortage of qualified personnel may require us to enhance our wage and benefits package in order to compete effectively in the hiring and retention of qualified employees. Our labor and benefit costs may continue to increase and such increases may not be recovered. This could have a material adverse affect on our business, operating results and financial condition.
In addition, as previously announced in April 2019, we are currently executing plans to further improve our vertically integrated operations with a number of initiatives. As a result of the ongoing evolution of our business, we frequently implement changes to our organizational design in order to more closely align our management structure with the needs of the business. In connection with such changes to our retail and wholesale structure, we also implement changes in personnel and reductions in force as a result of which we may incur severance costs and other reorganization charges and expenses. Changes in our organizational structure may also have an adverse impact on our ability to retain qualified personnel.
Our total assets include substantial amounts of long-lived assets, principally property and equipment. Changes to estimates or projections used to assess the fair value of these assets, financial results that are lower than current estimates at certain design center locations or determinations to close underperforming locations may cause us to incur future impairment charges, negatively affecting its financial results.
We make certain accounting estimates and projections with regard to individual design center operations as well as overall Company performance in connection with our impairment analysis for long-lived assets in accordance with applicable accounting guidance. An impairment charge may be required if the impairment analysis indicates that the carrying value of an asset exceeds the sum of the expected undiscounted cash flows of the asset. The projection of future cash flows used in this analysis requires the use of judgment and a number of estimates and projections of future operating results. If actual results differ from Company estimates, additional charges for asset impairments may be required in the future. If impairment charges are significant, our financial results could be negatively affected.
Access to consumer credit could be interrupted as a result of conditions outside of our control, which could reduce sales and profitability.
Our ability to continue to access consumer credit for our customers could be negatively affected by conditions outside our control. If capital market conditions have a material negative change, there is a risk that our business partner that issues our private label credit card program may not be able to fulfill its obligations under that agreement. In addition, the tightening of credit markets may restrict the ability and willingness of customers to make purchases.
ETHAN ALLEN INTERIORS INC. AND SUBSIDIARIES
We may not be able to maintain our current design center locations at current costs. We may also fail to successfully select and secure design center locations.
Our design centers are typically located in busy urban settings as freestanding destinations or as part of suburban strip malls or shopping malls, depending upon the real estate opportunities in a particular market. Our business competes with other retailers and as a result, our success may be affected by our ability to renew current design center leases and to select and secure appropriate retail locations for existing and future design centers.
Our business may be materially adversely affected by changes to fiscal and tax policies.
In the ordinary course of business, we are subject to tax examinations by various governmental tax authorities. The global and diverse nature of our business means that there could be additional examinations by governmental tax authorities and the resolution of ongoing and other probable audits, which could impose a future risk to the results of our business.
On December 22, 2017, the United States Tax Cuts and Jobs Act, (the “Act”) was signed into law. The Act enacted broad changes to the existing United States Internal Revenue code, including reducing the federal corporate income tax rate from 35% to 21%, among many other complex provisions. Guidance issued by the SEC provided a measurement period of one year from the enactment date to finalize the accounting for effects of the Act. In fiscal 2018, we made a provisional estimate of the effects of the Act on our existing deferred tax balances. In fiscal 2019 the measurement period ended, and no material adjustments were made to our provisional estimate of the impacts of the Act. The U.S. Treasury Department, the Internal Revenue Service and other standard-setting bodies could interpret or issue guidance on how provisions of the Act will be applied or otherwise administered that is different from our interpretation. Finally, foreign governments may enact tax laws in response to the Act that could result in further changes to global taxation and materially affect our financial position and results of operations. The uncertainty surrounding the effect of the reforms on our financial results and business could also weaken confidence among investors in our financial condition. This could, in turn, have a materially adverse affect on the price of our common stock.
Our operations present hazards and risks which may not be fully covered by insurance, if insured.
The scope and nature of our operations present a variety of operational hazards and risks that must be managed through continual oversight and control. As protection against hazards and risks, we maintain insurance against many, but not all, potential losses or liabilities arising from such risks. Uninsured losses and liabilities from operating risks could reduce the funds available to us for capital and investment spending and could have a material adverse impact on the results of operations.
Failure to protect our intellectual property could materially adversely affect us.
We believe that our copyrights, trademarks, service marks, trade secrets, and all of our other intellectual property are important to our success. We rely on patent, trademark, copyright and trade secret laws, and confidentiality and restricted use agreements, to protect our intellectual property and may seek licenses to intellectual property of others. Some of our intellectual property is not covered by any patent, trademark, or copyright or any applications for the same. We cannot provide assurance that agreements designed to protect our intellectual property will not be breached, that we will have adequate remedies for any such breach, or that the efforts we take to protect our proprietary rights will be sufficient or effective. Any significant impairment of our intellectual property rights or failure to obtain licenses of intellectual property from third parties could harm our business or our ability to compete. Moreover, we cannot provide assurance that the use of our technology or proprietary “know‐how” or information does not infringe the intellectual property rights of others. If we have to litigate to protect or defend any of our rights, such litigation could result in significant expense.
ITEM 1B. UNRESOLVED STAFF COMMENTS
None.
ETHAN ALLEN INTERIORS INC. AND SUBSIDIARIES
ITEM 2. PROPERTIES
Ethan Allen’s 144,000 square foot corporate headquarters building, located in Danbury, Connecticut, is owned by the Company.
We operate six manufacturing facilities located in the United States, Mexico and Honduras. These facilities are owned by the Company and include three case goods plants (including one sawmill) totaling 1,300,000 square feet and three upholstery furniture plants totaling 1,170,000 square feet. Two of our case goods manufacturing facilities are located in Vermont and one is in Honduras. We have two upholstery manufacturing facilities at our North Carolina campus and one in Mexico. Our wholesale division also owns and operates four national distribution and fulfillment centers, which are a combined 1,428,000 square feet. Our distribution facilities are located in North Carolina, Oklahoma, and Virginia.
We own three and lease 10 retail service centers, totaling approximately 770,000 square feet. Our retail service centers are located throughout the United States and Canada and serve to support our various retail design centers.
As of June 30, 2019 there were 144 Company operated retail design centers totaling 2,210,000 square feet, and averaging approximately 15,300 square feet in size per location. Of the 144 Company operated retail design centers, 50 of the properties are owned and 94 are leased. We own one and lease six additional retail properties, of which we sublease three to independent Ethan Allen retailers and four to unaffiliated third parties.
The location activity and geographic distribution of our retail network for fiscal years ended June 30 are as follows:
| |
|
Fiscal 2019
|
|
|
Fiscal 2018
|
|
| |
|
Independent
|
|
|
Company-
|
|
|
|
|
|
|
Independent
|
|
|
Company-
|
|
|
|
|
|
| |
|
retailers
|
|
|
operated
|
|
|
Total
|
|
|
retailers
|
|
|
operated
|
|
|
Total
|
|
|
Retail Design Center location activity:
|
|
|
|
|
|
|
|
|
|
|
|
|
|
|
|
|
|
|
|
|
|
|
|
|
|
Balance at July 1
|
|
|
148 |
|
|
|
148 |
|
|
|
296 |
|
|
|
155 |
|
|
|
148 |
|
|
|
303 |
|
|
New locations
|
|
|
21 |
|
|
|
3 |
|
|
|
24 |
|
|
|
11 |
|
|
|
2 |
|
|
|
13 |
|
|
Closures
|
|
|
(9 |
) |
|
|
(9 |
) |
|
|
(18 |
) |
|
|
(16 |
) |
|
|
(4 |
) |
|
|
(20 |
) |
|
Transfers
|
|
|
(2 |
) |
|
|
2 |
|
|
|
- |
|
|
|
(2 |
) |
|
|
2 |
|
|
|
- |
|
|
Balance at June 30
|
|
|
158 |
|
|
|
144 |
|
|
|
302 |
|
|
|
148 |
|
|
|
148 |
|
|
|
296 |
|
|
Relocations (in new and closures)
|
|
|
- |
|
|
|
3 |
|
|
|
3 |
|
|
|
- |
|
|
|
1 |
|
|
|
1 |
|
| |
|
|
|
|
|
|
|
|
|
|
|
|
|
|
|
|
|
|
|
|
|
|
|
|
|
Retail Design Center geographic locations:
|
|
|
|
|
|
|
|
|
|
|
|
|
|
|
|
|
|
|
|
|
|
|
|
|
|
United States
|
|
|
40 |
|
|
|
138 |
|
|
|
178 |
|
|
|
44 |
|
|
|
142 |
|
|
|
186 |
|
|
Canada
|
|
|
- |
|
|
|
6 |
|
|
|
6 |
|
|
|
- |
|
|
|
6 |
|
|
|
6 |
|
|
China
|
|
|
100 |
|
|
|
- |
|
|
|
100 |
|
|
|
87 |
|
|
|
- |
|
|
|
87 |
|
|
Other Asia
|
|
|
11 |
|
|
|
- |
|
|
|
11 |
|
|
|
9 |
|
|
|
- |
|
|
|
9 |
|
|
Europe
|
|
|
1 |
|
|
|
- |
|
|
|
1 |
|
|
|
1 |
|
|
|
- |
|
|
|
1 |
|
|
Middle East
|
|
|
6 |
|
|
|
- |
|
|
|
6 |
|
|
|
7 |
|
|
|
- |
|
|
|
7 |
|
|
Total
|
|
|
158 |
|
|
|
144 |
|
|
|
302 |
|
|
|
148 |
|
|
|
148 |
|
|
|
296 |
|
We believe that all our properties are well maintained and in good condition. We have additional capacity at each facility as we estimate that our manufacturing plants are currently operating at approximately 50% of capacity based on their current shifts and staffing. In an effort to further improve and optimize our manufacturing and logistics operations, we are currently executing the following plans, which we expect to be completed during fiscal 2020: (i) convert our Old Fort, North Carolina plant into a state-of-the-art distribution center to support our national distribution structure and growing United States government General Services Administration (“GSA”) contract business; (ii) consolidate United States case goods manufacturing to Vermont; (iii) expand our Maiden, North Carolina campus with the addition of 80,000 square feet; and (iv) move the distribution operations from our Passaic, New Jersey facility to our operations in North Carolina and outsource the art framing operations.
ETHAN ALLEN INTERIORS INC. AND SUBSIDIARIES
ITEM 3. LEGAL PROCEEDINGS
From time to time, we are subject to legal proceedings, claims and litigation arising in the ordinary course of business. Based on currently available information, we do not believe that the ultimate outcome of these unresolved matters against Ethan Allen, individually or in the aggregate, will have a material adverse affect on our consolidated financial position, our annual results of operations or our annual cash flows. However, these matters are subject to inherent uncertainties and our view of these matters may change in the future. For additional information regarding legal matters, refer to Note 20, Commitments and Contingencies, of the notes to our consolidated financial statements included under Item 8 of this Annual Report on Form 10-K.
Regulations issued under the Clean Air Act Amendments of 1990 required the industry to reformulate certain furniture finishes or institute process changes to reduce emissions of volatile organic compounds. Compliance with many of these requirements has been facilitated through the introduction of high solids coating technology and alternative formulations. In addition, we have instituted a variety of technical and procedural controls, including reformulation of finishing materials to reduce toxicity, implementation of high velocity low pressure spray systems, development of storm water protection plans and controls, and further development of related inspection/audit teams, all of which have served to reduce emissions per unit of production. We remain committed to implementing new waste minimization programs and/or enhancing existing programs with the objective of (i) reducing the total volume of waste, (ii) limiting the liability associated with waste disposal, and (iii) continuously improving environmental and job safety programs on the factory floor which serve to minimize emissions and safety risks for employees. To reduce the use of hazardous materials in the manufacturing process, we will continue to evaluate the most appropriate, cost-effective control technologies for finishing operations and production methods. We believe that our facilities are in material compliance with all such applicable laws and regulations. Our currently anticipated capital expenditures for environmental control facility matters are not material.
ITEM 4. MINE SAFETY DISCLOSURES
Not applicable.
ETHAN ALLEN INTERIORS INC. AND SUBSIDIARIES
PART II
ITEM 5. MARKET FOR REGISTRANT’S COMMON EQUITY, RELATED STOCKHOLDER MATTERS, AND ISSUER PURCHASES OF EQUITY SECURITIES
|
(a)
|
Market Information, Holders of Record, Dividends, Securities Authorized for Issuance and Stock Performance Graph
|
Market Information. Ethan Allen common stock is traded on the New York Stock Exchange (“NYSE”) under ticker symbol “ETH”.
Holders of Record. As of July 25, 2019, there were 221 shareholders of record of our common stock, including Cede & Co., the nominee of the Depository Trust Company. However, because many of our shares of common stock are held by brokers and other institutions on behalf of shareholders, we are unable to estimate the total number of shareholders represented by these record holders. The closing price of our common stock on July 25, 2019, was $20.63 per share as reported on the NYSE.
Dividends. The Company’s policy is to issue quarterly dividends, and we expect to continue to declare and pay comparable quarterly dividends for the foreseeable future, business conditions permitting.
Securities Authorized for Issuance under Equity Compensation Plans. Refer to Part III of this Annual Report on Form 10-K.
Stock Performance Graph. The annual changes for the five-year period shown in the graph below are based on the assumption that $100 had been invested in our common stock, the Standard & Poor’s 500 Index and the Standard & Poor’s Retail Select Industry Index (“SPSIRE”) on June 30, 2014. The total cumulative dollar returns shown on the graph represent the value that such investments would have had on June 30, 2019. Stockholder returns over the indicated period are based on historical data and should not be considered indicative of future stockholder returns.
*This performance graph shall not be deemed “soliciting material” or to be “filed” with the SEC for purposes of Section 18 of the Securities Exchange Act of 1934, as amended (the “Exchange Act”), or otherwise subject to the liabilities under that Section, and shall not be deemed to be incorporated by reference into any filing of Ethan Allen under the Securities Act of 1933, as amended, or the Exchange Act whether made before or after the date hereof and irrespective of any general incorporation language in any such filing.
|
(b)
|
Recent Sales of Unregistered Securities
|
There were no sales of unregistered equity securities during fiscal 2019.
|
(c)
|
Purchases of Equity Securities by the Issuer
|
We may from time to time make repurchases in the open market and through privately negotiated transactions, subject to market conditions, including pursuant to our previously announced repurchase program. There were no share repurchases under the program during fiscal 2019. At June 30, 2019, we had a remaining Board authorization to repurchase 2,518,046 shares of our common stock pursuant to our program.
ETHAN ALLEN INTERIORS INC. AND SUBSIDIARIES
ITEM 6. SELECTED FINANCIAL DATA
The following tables set forth, for the periods and at the dates indicated, our selected historical consolidated financial data. We have derived the selected consolidated financial data for the years ended June 30, 2019, 2018 and 2017, and as of June 30, 2019 and 2018, from our audited consolidated financial statements appearing elsewhere in this report. We have derived the selected consolidated financial data for the years ended June 30, 2016 and 2015, and as of June 30, 2017, 2016 and 2015 from our consolidated financial statements not appearing elsewhere in this report. Our historical results are not necessarily indicative of the results we may achieve in any future period.
This financial data should be read in conjunction with Item 7, Management’s Discussion and Analysis of Financial Condition and Results of Operations and Item 8, Financial Statements and Supplementary Data, of this Annual Report on Form 10-K.
|
(in thousands, except per share data)
|
|
Fiscal Year Ended June 30,
|
|
| |
|
2019
|
|
|
2018
|
|
|
2017
|
|
|
2016
|
|
|
2015
|
|
|
Consolidated Statements of Income Data
|
|
|
|
|
|
|
|
|
|
|
|
|
|
|
|
|
|
|
|
|
|
Net Sales
|
|
$ |
746,684 |
|
|
$ |
766,784 |
|
|
$ |
763,385 |
|
|
$ |
794,202 |
|
|
$ |
754,600 |
|
|
Gross Margin
|
|
|
54.8 |
% |
|
|
54.2 |
% |
|
|
55.0 |
% |
|
|
55.7 |
% |
|
|
54.5 |
% |
|
Operating income(1)
|
|
$ |
33,947 |
|
|
$ |
48,867 |
|
|
$ |
57,950 |
|
|
$ |
89,179 |
|
|
$ |
65,934 |
|
|
Operating margin(1)
|
|
|
4.5 |
% |
|
|
6.4 |
% |
|
|
7.6 |
% |
|
|
11.2 |
% |
|
|
8.7 |
% |
|
Provision for income taxes
|
|
$ |
8,162 |
|
|
$ |
12,696 |
|
|
$ |
20,801 |
|
|
$ |
31,319 |
|
|
$ |
19,541 |
|
|
Effective tax rate
|
|
|
24.1 |
% |
|
|
25.9 |
% |
|
|
36.5 |
% |
|
|
35.6 |
% |
|
|
34.5 |
% |
|
Net income(2)
|
|
$ |
25,698 |
|
|
$ |
36,371 |
|
|
$ |
36,194 |
|
|
$ |
56,637 |
|
|
$ |
37,142 |
|
| |
|
|
|
|
|
|
|
|
|
|
|
|
|
|
|
|
|
|
|
|
|
Per Share Data
|
|
|
|
|
|
|
|
|
|
|
|
|
|
|
|
|
|
|
|
|
|
Net income per basic share(3)
|
|
$ |
0.96 |
|
|
$ |
1.33 |
|
|
$ |
1.31 |
|
|
$ |
2.02 |
|
|
$ |
1.29 |
|
|
Basic weighted average shares
|
|
|
26,695 |
|
|
|
27,321 |
|
|
|
27,679 |
|
|
|
28,072 |
|
|
|
28,874 |
|
|
Net income per diluted share(3)
|
|
$ |
0.96 |
|
|
$ |
1.32 |
|
|
$ |
1.29 |
|
|
$ |
2.00 |
|
|
$ |
1.27 |
|
|
Diluted weighted average shares
|
|
|
26,751 |
|
|
|
27,625 |
|
|
|
27,958 |
|
|
|
28,324 |
|
|
|
29,182 |
|
|
Cash dividends declared per share
|
|
$ |
1.76 |
|
|
$ |
1.07 |
|
|
$ |
0.74 |
|
|
$ |
0.62 |
|
|
$ |
0.50 |
|
| |
|
|
|
|
|
|
|
|
|
|
|
|
|
|
|
|
|
|
|
|
|
Other Information
|
|
|
|
|
|
|
|
|
|
|
|
|
|
|
|
|
|
|
|
|
|
Depreciation and amortization
|
|
$ |
19,637 |
|
|
$ |
19,831 |
|
|
$ |
20,115 |
|
|
$ |
19,353 |
|
|
$ |
19,142 |
|
|
Capital expenditures and acquisitions
|
|
$ |
9,654 |
|
|
$ |
18,773 |
|
|
$ |
18,321 |
|
|
$ |
23,132 |
|
|
$ |
21,778 |
|
|
Cash dividends paid
|
|
$ |
46,990 |
|
|
$ |
29,509 |
|
|
$ |
20,031 |
|
|
$ |
16,646 |
|
|
$ |
13,348 |
|
|
Working capital
|
|
$ |
93,464 |
|
|
$ |
93,165 |
|
|
$ |
116,653 |
|
|
$ |
124,857 |
|
|
$ |
130,012 |
|
|
Current ratio
|
|
|
1.76 to 1 |
|
|
|
1.77 to 1 |
|
|
|
1.92 to 1 |
|
|
|
2.01 to 1 |
|
|
|
1.92 to 1 |
|
| |
|
|
|
|
|
|
|
|
|
|
|
|
|
|
|
|
|
|
|
|
|
Consolidated Balance Sheet Data (at end of period)
|
|
|
|
|
|
|
|
|
|
|
|
|
|
|
|
|
|
|
Cash and cash equivalents
|
|
$ |
20,824 |
|
|
$ |
22,363 |
|
|
$ |
57,701 |
|
|
$ |
52,659 |
|
|
$ |
76,182 |
|
|
Total assets
|
|
$ |
510,351 |
|
|
$ |
530,433 |
|
|
$ |
568,222 |
|
|
$ |
577,409 |
|
|
$ |
605,977 |
|
|
Long-term debt
|
|
$ |
516 |
|
|
$ |
1,096 |
|
|
$ |
11,608 |
|
|
$ |
38,837 |
|
|
$ |
73,203 |
|
|
Total liabilities
|
|
$ |
146,422 |
|
|
$ |
146,563 |
|
|
$ |
167,326 |
|
|
$ |
185,207 |
|
|
$ |
235,442 |
|
|
Shareholders' equity
|
|
$ |
363,929 |
|
|
$ |
383,870 |
|
|
$ |
400,896 |
|
|
$ |
392,202 |
|
|
$ |
370,535 |
|
|
Long-term debt to equity ratio
|
|
|
0.1 |
% |
|
|
0.3 |
% |
|
|
2.9 |
% |
|
|
9.9 |
% |
|
|
19.8 |
% |
| |
|
|
|
|
|
|
|
|
|
|
|
|
|
|
|
|
|
|
|
|
|
(1) Operating income in fiscal 2019 included pre-tax charges of $20.4 million from restructuring and impairment charges ($2.0 million is reported in cost of sales and $18.4 million in operating expenses) and $0.7 million related to other corporate actions, which combined to lower operating margin by 2.9%.
|
| |
|
(2) Net income in fiscal 2019 included after-tax charges of $15.4 million related to restructuring and impairment charges and $0.6 million (after-tax) from other corporate actions.
|
| |
|
(3) Diluted EPS in fiscal 2019 included a $0.58 decrease from restructuring and impairment charges and $0.02 decrease from other corporate actions.
|
ETHAN ALLEN INTERIORS INC. AND SUBSIDIARIES
ITEM 7. MANAGEMENT’S DISCUSSION AND ANALYSIS OF FINANCIAL CONDITION AND RESULTS OF OPERATIONS
Management’s Discussion and Analysis of Financial Condition and Results of Operations (“MD&A”) is designed to provide a reader of our financial statements with a narrative from the perspective of our management on our financial condition, results of operations, liquidity and certain other factors that may affect our future results.
The MD&A is based upon, and should be read in conjunction with, our Consolidated Financial Statements and related Notes included under Item 8 of this Annual Report on Form 10-K.
Executive Overview
Who We Are. We are a leading interior design company and manufacturer and retailer of quality home furnishings. Founded over 87 years ago, today we are a leading international home fashion brand doing business in North America, Europe, Asia and the Middle East. We are vertically integrated from design through delivery, affording our clientele a value proposition of style, quality and price. We offer complementary interior design service to our clients and sell a full range of furniture products and decorative accents through ethanallen.com and a network of approximately 300 design centers in the United States and abroad. The design centers represent a mix of independent licensees and our own Company operated retail segment. We own and operate six manufacturing facilities, including three manufacturing plants and one sawmill in the United States and one manufacturing plant in Mexico and one in Honduras.
Business Model. Our business model is to maintain continued focus on (i) capitalizing on the strength of our interior design professionals and management in our retail design centers, (ii) communicating our messages with strong advertising and marketing campaigns, (iii) utilizing ethanallen.com as a key marketing tool to drive traffic to our design centers, (iv) investing in new technologies across key aspects of our vertically integrated business, and (v) leveraging the benefits of our vertical integration by maintaining a strong manufacturing capacity in North America where we manufacture approximately 75% of our products.
Our competitive advantages arise from:
| |
●
|
providing fashionable high-quality products of the finest craftsmanship;
|
| |
●
|
offering complimentary design service through approximately 2,000 motivated interior design professionals network-wide;
|
| |
●
|
offering a wide array of custom products across our upholstery, case goods, and accent product categories;
|
| |
●
|
enhancing our technology in all aspects of the business; and
|
| |
●
|
leveraging our vertically integrated structure.
|
Transformation. We have completed a major transformation of our product offerings, having refreshed over 70% of our entire product line over the past three years. In the past 12 months, we further strengthened our offerings with relevant new products featuring a modern perspective on classic designs. During fiscal 2019, we successfully introduced our Relaxed Modern product line, a casual, livable, inspired by nature, transitional design made of mixed materials as well as expanded our Home & Garden collection. Our contract sales, including sales to the GSA, hospitality and other commercial businesses, continue to grow and the GSA has become one of our ten largest customers. Our internet sales, while still a low percentage of our consolidated sales, are growing at a rate that continues to out-pace our brick and mortar design centers.
Fiscal 2019 Year in Review.(1) Improved adjusted gross margin, cost containment within our expenses and a lower effective tax rate helped increase our adjusted diluted earnings per share in fiscal 2019 to $1.56, up 15.6%. Consolidated net sales decreased 2.6% due to a decline of 7.2% within our wholesale segment partially offset by growth in our retail segment of 0.4%. Consolidated international net sales for fiscal 2019 decreased $27.4 million primarily due to lower sales in China and made up 6.8% of our consolidated net sales compared with 10.2% in the prior year period. Our adjusted gross margin expanded 90 basis points to 55.1%, driven by a price increase and a change in the retail segment sales mix relative to total consolidated sales, which was 79.0% compared with 76.6% in the year ago period. Adjusted operating income, which excludes $21.1 million of pre-tax charges from restructuring initiatives, asset impairments and other corporate actions, rose 9.8% during the current year due to lower national television advertising costs and a reduction in share-based compensation. The full year fiscal 2019 effective income tax rate was 24.1% compared with 25.9% in the prior year due to tax law changes resulting from the Tax Act. As of June 30, 2019, our balance sheet remains strong with cash and cash equivalents of $20.8 million and inventory of $162.4 million. During the fiscal 2019 year we paid $47.0 million in dividends, including a special dividend payment of $26.7 million, reflecting an annual increase of 59.2%. In addition, during December 2018 we entered into a five-year, $165 million senior secured revolving credit facility, which amended and restated the previously existing facility. To partially fund the special cash dividend paid to shareholders in January 2019, we borrowed $16.0 million from the revolving credit facility and subsequently repaid this borrowing in full by June 30, 2019, using cash generated from operating activities.
|
(1)
|
Refer to the Regulation G Reconciliation of Non-GAAP Financial Measures section within this MD&A for the reconciliation of U.S. GAAP to adjusted key financial metrics.
|
ETHAN ALLEN INTERIORS INC. AND SUBSIDIARIES
Optimization of Manufacturing and Logistics. During April 2019 we announced plans to further improve our vertically integrated operations with a number of initiatives including converting our case goods manufacturing plant in North Carolina to a state-of-the-art distribution center, consolidating case goods manufacturing to our Vermont and other plants, adding a 80,000 square foot addition to one of our upholstery plants and moving our distribution operations from New Jersey to North Carolina. For these actions, we recorded pre-tax restructuring, impairment, and other related charges totaling $8.3 million, consisting of $3.1 million in impairments of long-lived assets, $2.8 million in employee severance and other payroll and benefit costs, $2.0 million in inventory write-downs and manufacturing variances and $0.4 million of other associated costs, including freight and relocation expenses. Consistent with our overall strategy to maximize production efficiencies and maintain competitive advantage, we have also reduced our employee headcount by approximately 380 positions as part of our efforts to consolidate our manufacturing and logistics operations.
Retail Segment Impairment Charges. During fiscal 2019 we recorded $12.1 million of impairment and exit charges within the retail segment. Approximately $9.9 million was an impairment charge for long-lived assets held at the retail design center level. An additional $2.1 million primarily represented remaining contractual obligations under leased space for which we ceased using as of June 30, 2019.
Key Operating Metrics
A summary of our key operating metrics is presented in the following table ($ in millions, except per share amounts).
| |
|
Fiscal Year Ended June 30,
|
|
| |
|
2019
|
|
|
% of Sales
|
|
|
2018
|
|
|
% of Sales
|
|
|
2017
|
|
|
% of Sales
|
|
|
Net sales
|
|
$ |
746.7 |
|
|
|
100.0 |
% |
|
$ |
766.8 |
|
|
|
100.0 |
% |
|
$ |
763.4 |
|
|
|
100.0 |
% |
|
Gross profit
|
|
$ |
409.5 |
|
|
|
54.8 |
% |
|
$ |
416.0 |
|
|
|
54.2 |
% |
|
$ |
419.7 |
|
|
|
55.0 |
% |
|
Adjusted gross profit(1)
|
|
$ |
411.5 |
|
|
|
55.1 |
% |
|
$ |
416.0 |
|
|
|
54.2 |
% |
|
$ |
426.1 |
|
|
|
55.8 |
% |
|
Operating income
|
|
$ |
33.9 |
|
|
|
4.5 |
% |
|
$ |
48.9 |
|
|
|
6.4 |
% |
|
$ |
58.0 |
|
|
|
7.6 |
% |
|
Adjusted operating income(1)
|
|
$ |
55.1 |
|
|
|
7.4 |
% |
|
$ |
50.1 |
|
|
|
6.5 |
% |
|
$ |
65.0 |
|
|
|
8.5 |
% |
|
Net income
|
|
$ |
25.7 |
|
|
|
3.4 |
% |
|
$ |
36.4 |
|
|
|
4.7 |
% |
|
$ |
36.2 |
|
|
|
4.7 |
% |
|
Adjusted net income(1)
|
|
$ |
41.6 |
|
|
|
5.6 |
% |
|
$ |
37.3 |
|
|
|
4.9 |
% |
|
$ |
40.6 |
|
|
|
5.3 |
% |
|
Diluted EPS
|
|
$ |
0.96 |
|
|
|
|
|
|
$ |
1.32 |
|
|
|
|
|
|
$ |
1.29 |
|
|
|
|
|
|
Adjusted diluted EPS(1)
|
|
$ |
1.56 |
|
|
|
|
|
|
$ |
1.35 |
|
|
|
|
|
|
$ |
1.45 |
|
|
|
|
|
|
Cash flow from operating activities
|
|
$ |
55.2 |
|
|
|
|
|
|
$ |
42.5 |
|
|
|
|
|
|
$ |
78.6 |
|
|
|
|
|
|
(1)
|
Refer to the Regulation G Reconciliation of Non-GAAP Financial Measures section within this MD&A for the reconciliation of U.S. GAAP to adjusted key financial metrics.
|
A summary of changes from the applicable periods in the preceding fiscal year is presented in the following table.
| |
|
Fiscal Year Ended June 30,
|
|
| |
|
2019
|
|
|
2018
|
|
|
2017
|
|
|
Net sales
|
|
|
(2.6% |
) |
|
|
0.4 |
% |
|
|
(3.9% |
) |
|
Gross Profit
|
|
|
(1.6% |
) |
|
|
(0.9% |
) |
|
|
(5.1% |
) |
|
Adjusted gross profit(1)
|
|
|
(1.1% |
) |
|
|
(2.4% |
) |
|
|
(3.6% |
) |
|
Operating income
|
|
|
(30.5% |
) |
|
|
(15.7% |
) |
|
|
(35.0% |
) |
|
Adjusted operating income(1)
|
|
|
9.8 |
% |
|
|
(22.8% |
) |
|
|
(25.3% |
) |
|
Net income
|
|
|
(29.3% |
) |
|
|
0.5 |
% |
|
|
(36.1% |
) |
|
Adjusted net income(1)
|
|
|
11.6 |
% |
|
|
(8.2% |
) |
|
|
(25.4% |
) |
|
Diluted EPS
|
|
|
(27.3% |
) |
|
|
2.3 |
% |
|
|
(35.5% |
) |
|
Adjusted diluted EPS(1)
|
|
|
15.6 |
% |
|
|
(6.9% |
) |
|
|
(24.5% |
) |
|
Cash flows from operating activites
|
|
|
30.0 |
% |
|
|
(46.0% |
) |
|
|
34.7 |
% |
|
(1)
|
Refer to the Regulation G Reconciliation of Non-GAAP Financial Measures section within this MD&A for the reconciliation of U.S. GAAP to adjusted key financial metrics.
|
ETHAN ALLEN INTERIORS INC. AND SUBSIDIARIES
The components of consolidated net sales and operating income (loss) by business segment are presented in the following table ($ in millions):
| |
|
Fiscal Year Ended June 30,
|
|
| |
|
2019
|
|
|
2018
|
|
|
2017
|
|
|
Net sales
|
|
|
|
|
|
|
|
|
|
|
|
|
|
Wholesale segment
|
|
$ |
441.6 |
|
|
$ |
475.7 |
|
|
$ |
453.3 |
|
|
Retail segment
|
|
|
589.8 |
|
|
|
587.5 |
|
|
|
603.7 |
|
|
Elimination of intersegment sales
|
|
|
(284.7 |
) |
|
|
(296.4 |
) |
|
|
(293.6 |
) |
|
Consolidated net sales
|
|
$ |
746.7 |
|
|
$ |
766.8 |
|
|
$ |
763.4 |
|
| |
|
|
|
|
|
|
|
|
|
|
|
|
|
Operating income (loss):
|
|
|
|
|
|
|
|
|
|
|
|
|
|
Wholesale segment
|
|
$ |
42.4 |
|
|
$ |
48.5 |
|
|
$ |
53.5 |
|
|
Retail segment
|
|
|
(10.5 |
) |
|
|
(1.7 |
) |
|
|
1.2 |
|
|
Elimination of intercompany profit(1)
|
|
|
2.0 |
|
|
|
2.1 |
|
|
|
3.3 |
|
|
Consolidated operating income
|
|
$ |
33.9 |
|
|
$ |
48.9 |
|
|
$ |
58.0 |
|
|
(1)
|
Represents the change in wholesale profit contained in Ethan Allen-operated design center inventory existing at the end of the period.
|
A summary by business segment changes from the applicable periods in the preceding fiscal year is presented in the following table:
| |
|
Fiscal Year Ended June 30,
|
|
| |
|
2019
|
|
|
2018
|
|
|
2017
|
|
|
Wholesale segment:
|
|
|
|
|
|
|
|
|
|
|
|
|
|
Net sales
|
|
|
(7.2% |
) |
|
|
4.9 |
% |
|
|
(7.8% |
) |
|
Operating income
|
|
|
(12.4% |
) |
|
|
(9.4% |
) |
|
|
(28.1% |
) |
|
Backlog
|
|
|
(18.0% |
) |
|
|
19.3 |
% |
|
|
17.6 |
% |
| |
|
|
|
|
|
|
|
|
|
|
|
|
|
Retail segment:
|
|
|
|
|
|
|
|
|
|
|
|
|
|
Net sales
|
|
|
0.4 |
% |
|
|
(2.7% |
) |
|
|
(3.6% |
) |
|
Comparable design center net sales
|
|
|
(0.8% |
) |
|
|
(3.2% |
) |
|
|
(4.6% |
) |
|
Total written orders
|
|
|
(1.4% |
) |
|
|
(3.1% |
) |
|
|
(0.9% |
) |
|
Comparable design center written orders
|
|
|
(2.7% |
) |
|
|
(3.8% |
) |
|
|
(2.5% |
) |
|
Operating income
|
|
|
(505.8% |
) |
|
|
(245.1% |
) |
|
|
(92.7% |
) |
|
Backlog
|
|
|
(11.0% |
) |
|
|
(2.3% |
) |
|
|
(1.0% |
) |
The following table shows selected design center location information.
| |
|
Fiscal 2019
|
|
|
Fiscal 2018
|
|
| |
|
Independent
|
|
|
Company-
|
|
|
|
|
|
|
Independent
|
|
|
Company-
|
|
|
|
|
|
| |
|
retailers
|
|
|
operated
|
|
|
Total
|
|
|
retailers
|
|
|
operated
|
|
|
Total
|
|
|
Retail Design Center location activity:
|
|
|
|
|
|
|
|
|
|
|
|
|
|
|
|
|
|
|
|
|
|
|
|
|
|
Balance at July 1
|
|
|
148 |
|
|
|
148 |
|
|
|
296 |
|
|
|
155 |
|
|
|
148 |
|
|
|
303 |
|
|
New locations
|
|
|
21 |
|
|
|
3 |
|
|
|
24 |
|
|
|
11 |
|
|
|
2 |
|
|
|
13 |
|
|
Closures
|
|
|
(9 |
) |
|
|
(9 |
) |
|
|
(18 |
) |
|
|
(16 |
) |
|
|
(4 |
) |
|
|
(20 |
) |
|
Transfers
|
|
|
(2 |
) |
|
|
2 |
|
|
|
- |
|
|
|
(2 |
) |
|
|
2 |
|
|
|
- |
|
|
Balance at June 30
|
|
|
158 |
|
|
|
144 |
|
|
|
302 |
|
|
|
148 |
|
|
|
148 |
|
|
|
296 |
|
|
Relocations (in new and closures)
|
|
|
- |
|
|
|
3 |
|
|
|
3 |
|
|
|
- |
|
|
|
1 |
|
|
|
1 |
|
| |
|
|
|
|
|
|
|
|
|
|
|
|
|
|
|
|
|
|
|
|
|
|
|
|
|
Retail Design Center geographic locations:
|
|
|
|
|
|
|
|
|
|
|
|
|
|
|
|
|
|
|
|
|
|
|
|
|
|
United States
|
|
|
40 |
|
|
|
138 |
|
|
|
178 |
|
|
|
44 |
|
|
|
142 |
|
|
|
186 |
|
|
Canada
|
|
|
- |
|
|
|
6 |
|
|
|
6 |
|
|
|
- |
|
|
|
6 |
|
|
|
6 |
|
|
China
|
|
|
100 |
|
|
|
- |
|
|
|
100 |
|
|
|
87 |
|
|
|
- |
|
|
|
87 |
|
|
Other Asia
|
|
|
11 |
|
|
|
- |
|
|
|
11 |
|
|
|
9 |
|
|
|
- |
|
|
|
9 |
|
|
Europe
|
|
|
1 |
|
|
|
- |
|
|
|
1 |
|
|
|
1 |
|
|
|
- |
|
|
|
1 |
|
|
Middle East
|
|
|
6 |
|
|
|
- |
|
|
|
6 |
|
|
|
7 |
|
|
|
- |
|
|
|
7 |
|
|
Total
|
|
|
158 |
|
|
|
144 |
|
|
|
302 |
|
|
|
148 |
|
|
|
148 |
|
|
|
296 |
|
ETHAN ALLEN INTERIORS INC. AND SUBSIDIARIES
Results of Operations
For an understanding of the significant factors that influenced our financial performance during the past two fiscal years, the following discussion should be read in conjunction with the consolidated financial statements and related notes presented under Item 8 in this Annual Report on Form 10-K ($ in millions, except per share amounts).
Fiscal 2019 Compared to Fiscal 2018
Consolidated net sales for fiscal 2019 were $746.7 million, a decrease of 2.6% compared to the same prior year period. Net sales decreased by 7.2% for our wholesale segment, which were partly offset by a 0.4% increase in our retail segment. There was a $27.4 million decrease in international sales from our combined retail and wholesale segments, which was primarily related to the economic uncertainty surrounding international trade disputes, lower sales in China and a slowing global economy.
Wholesale net sales decreased by $34.2 million or 7.2%, to $441.6 million. The lower net sales were primarily due to a $22.3 million decline in sales to China and an $18.3 million reduction in sales to our North American independent retail network. Partially offsetting these declines was growth in contract sales, which grew $19.5 million year over year. The year over year increase in contract sales was primarily attributable to higher sales from the GSA contract. There were 302 design centers globally as of June 30, 2019, an increase of six in the past 12 months. Our international net sales to independent retailers was 4.1% of our consolidated net sales compared to 7.0%. Our backlog at June 30, 2019 was down 18.0% compared to the prior year as our manufacturing operations returned to normal throughput as compared to the prior year’s longer production lead-times primarily related to the GSA contract startup.
Retail net sales from Ethan Allen operated design centers increased by $2.3 million, or 0.4%, to $589.8 million. There was a 1.2% increase in sales in the United States, while sales from the Canadian design centers decreased 17.3%. Comparative retail net sales decreased 0.8%. There were 144 Company operated design centers at the end of fiscal 2019, down from 148 at the beginning of the year. Total written business (new orders booked) decreased 1.4%, with the United States decreasing 0.9% while Canada declined 13.9%. Comparable design center written business was down 2.7% during fiscal 2019 in total. Regional economic conditions in Canada, where we have six design centers, were negatively impacted in fiscal 2019 due to the trade dispute and additional tariffs levied during most of the year. A higher increase in retail net sales relative to written orders is reflected in the 11.0% decrease in our ending retail order backlog at June 30, 2019.
Gross profit decreased 1.6% to $409.5 million compared to the prior year period due to a 9.1% decline in profit within our wholesale segment, while our retail segment grew 3.0%. Wholesale gross profit in fiscal 2019 was negatively impacted by lower sales volume and restructuring actions taken during the year, partially offset by a change in product mix. Our fiscal 2019 gross margin improved to 54.8%, up from 54.2% in the prior year. Retail sales as a percent of total consolidated sales were 79.0% for the year compared with 76.6% in the prior fiscal year, which sales mix increased our consolidated gross margin. A price increase during fiscal 2019 improved retail gross profit, while lower wholesale sales volume negatively impacted gross profit. The restructuring actions, which included the write off of inventory, higher unfavorable manufacturing variances and incremental freight and relocation costs, negatively impacted our fiscal 2019 gross margin by 30 basis points.
Operating expenses increased $8.4 million or 2.3% to $375.5 million or 50.3% of net sales in fiscal 2019 from $367.1 million or 47.9% of net sales in fiscal 2018. The increase in operating expenses was due to $18.4 million in restructuring and impairments charges and higher occupancy and retail management costs partially offset by lower national television advertising costs of $14.4 million.
Operating income for fiscal 2019 totaled $33.9 million, or 4.5% of net sales, compared to $48.9 million, or 6.4% of net sales, in the prior fiscal year. The primary causes for the decrease in operating income was lower net sales of $20.1 million and restructuring charges in the current fiscal year of $18.4 million partially offset by a higher gross margin and a reduction in national television advertising costs.
Wholesale operating income totaled $42.5 million, or 9.6% of net sales, as compared to $48.5 million, or 10.2% of net sales, in the prior year. The decrease was largely due to lower sales volumes, restructuring actions which included $2.0 million within cost of goods sold and $6.3 million within operating expenses during fiscal 2019 and lower margins in upholstery. These decreases were partially offset by lower advertising costs and improved gross margins in case goods and home accents.
Retail operating loss was $10.5 million, or 1.8% of sales for fiscal 2019, compared to a loss of $1.7 million, or 0.3% of sales, for fiscal 2018, a decrease of $8.8 million. Restructuring and impairments charges lowered retail operating income by $12.1 million during fiscal 2019. These charges were partially offset by a higher gross margin.
ETHAN ALLEN INTERIORS INC. AND SUBSIDIARIES
Income tax expense was $8.2 million for fiscal 2019 and $12.7 million for fiscal 2018. Our effective tax rate for fiscal 2019 was 24.1% compared to 25.9% in fiscal 2018. The effective tax rate of 24.1% primarily includes a provision for income tax on the current year’s taxable income, including federal, state and local taxes, tax expense on the establishment and maintenance of a valuation allowance on Canadian deferred tax assets, and tax and interest expense on uncertain tax positions, partially offset by the reversal of various uncertain tax positions. The decrease from 25.9% in the prior fiscal year to 24.1% in the current fiscal year was primarily driven by being able to recognize a full year benefit of the Tax Act, which required us to compute income taxes expense for fiscal 2018 using a blended rate of 28% and 21% while fiscal 2019 was able to utilize the 21% rate for the full year.
Net income for fiscal 2019 was $25.7 million compared with $36.4 million for the prior year period, which resulted in $0.96 per diluted share compared to $1.32 in the prior year period. Fiscal 2019 restructuring and impairment charges of $20.4 million along with other corporate actions during the year totaled $0.7 million, which lowered diluted EPS by $0.60. Fiscal 2018 was negatively impacted by organizational changes and other exit costs of $0.03 per diluted share.
Fiscal 2018 Compared to Fiscal 2017
For a comparison of our results of operations for the fiscal years ended June 30, 2018 and 2017, see Item 7, Management’s Discussion and Analysis of Financial Condition and Results of Operations, of our Annual Report on Form 10-K for the fiscal year ended June 30, 2018, filed with the SEC on August 2, 2018.
Regulation G Reconciliations of Non-GAAP Financial Measures
To supplement the financial measures prepared in accordance with U.S. GAAP, we use non-GAAP financial measures including adjusted gross profit and margin, adjusted operating income, adjusted retail operating income and margin, adjusted wholesale operating income and margin, adjusted net income and adjusted diluted earnings per share. The reconciliations of these non-GAAP financial measures to the most directly comparable financial measures calculated and presented in accordance with GAAP are shown in tables below.
These non-GAAP measures are derived from the consolidated financial statements, but are not presented in accordance with generally accepted accounting principles in the U.S., or U.S. GAAP. We believe these non-GAAP measures provide a meaningful comparison of our results to others in our industry and our prior year results. Investors should consider these non-GAAP financial measures in addition to, and not as a substitute for, our financial performance measures prepared in accordance with U.S. GAAP. Moreover, these non-GAAP financial measures have limitations in that they do not reflect all the items associated with the operations of the business as determined in accordance with U.S. GAAP. Other companies may calculate similarly titled non-GAAP financial measures differently than we do, limiting the usefulness of those measures for comparative purposes.
Despite the limitations of these non-GAAP financial measures, we believe these adjusted financial measures and the information they provide are useful in viewing our performance using the same tools that management uses to assess progress in achieving our goals. Adjusted measures may also facilitate comparisons to our historical performance.
The following tables below show a reconciliation of non-GAAP financial measures used in this filing to the most directly comparable GAAP financial measures (in thousands, except per share data).
| |
|
Fiscal Year Ended June 30,
|
|
|
|
|
|
| |
|
2019
|
|
|
2018
|
|
|
% Change
|
|
|
Consolidated Adjusted Gross Profit / Gross Margin
|
|
|
|
|
|
|
|
|
|
|
GAAP Gross profit
|
|
$ |
409,491 |
|
|
$ |
415,964 |
|
|
|
(1.6% |
) |
|
Adjustments (pre-tax) *
|
|
|
1,994 |
|
|
|
- |
|
|
|
|
|
|
Adjusted gross profit *
|
|
$ |
411,485 |
|
|
$ |
415,964 |
|
|
|
(1.1% |
) |
|
Adjusted gross margin *
|
|
|
55.1 |
% |
|
|
54.2 |
% |
|
|
|
|
| |
|
|
|
|
|
|
|
|
|
|
|
|
|
Adjusted Operating Income / Operating Margin
|
|
|
|
|
|
|
|
|
|
|
GAAP Operating income
|
|
$ |
33,947 |
|
|
$ |
48,867 |
|
|
|
(30.5% |
) |
|
Adjustments (pre-tax) *
|
|
|
21,104 |
|
|
|
1,278 |
|
|
|
|
|
|
Adjusted operating income *
|
|
$ |
55,051 |
|
|
$ |
50,145 |
|
|
|
9.8 |
% |
| |
|
|
|
|
|
|
|
|
|
|
|
|
|
Net sales
|
|
$ |
746,684 |
|
|
$ |
766,784 |
|
|
|
|
|
|
GAAP Operating margin
|
|
|
4.5 |
% |
|
|
6.4 |
% |
|
|
|
|
|
Adjusted operating margin *
|
|
|
7.4 |
% |
|
|
6.5 |
% |
|
|
|
|
|
Adjusted Net Income / Adjusted Diluted EPS
|
|
|
|
|
|
|
|
|
|
|
|
|
|
GAAP Net income
|
|
$ |
25,698 |
|
|
$ |
36,371 |
|
|
|
(29.3% |
) |
|
Adjustments, net of tax *
|
|
|
15,934 |
|
|
|
935 |
|
|
|
|
|
|
Adjusted net income
|
|
$ |
41,632 |
|
|
$ |
37,306 |
|
|
|
11.6 |
% |
|
Diluted weighted average common shares
|
|
|
26,751 |
|
|
|
27,625 |
|
|
|
|
|
|
GAAP Diluted EPS
|
|
$ |
0.96 |
|
|
$ |
1.32 |
|
|
|
(27.3% |
) |
|
Adjusted diluted EPS *
|
|
$ |
1.56 |
|
|
$ |
1.35 |
|
|
|
15.6 |
% |
| |
|
|
|
|
|
|
|
|
|
|
|
|
|
Wholesale Adjusted Operating Income / Adjusted Operating Margin
|
|
|
|
|
|
|
|
|
|
|
Wholesale GAAP operating income
|
|
$ |
42,481 |
|
|
$ |
48,499 |
|
|
|
(12.4% |
) |
|
Adjustments (pre-tax) *
|
|
|
8,498 |
|
|
|
1,035 |
|
|
|
|
|
|
Adjusted wholesale operating income *
|
|
$ |
50,979 |
|
|
$ |
49,534 |
|
|
|
2.9 |
% |
| |
|
|
|
|
|
|
|
|
|
|
|
|
|
Wholesale net sales
|
|
$ |
441,551 |
|
|
$ |
475,731 |
|
|
|
|
|
|
Wholesale GAAP operating margin
|
|
|
9.6 |
% |
|
|
10.2 |
% |
|
|
|
|
|
Adjusted wholesale operating margin *
|
|
|
11.5 |
% |
|
|
10.4 |
% |
|
|
|
|
| |
|
|
|
|
|
|
|
|
|
|
|
|
|
Retail Adjusted Operating Income / Adjusted Operating Margin
|
|
|
|
|
|
|
|
|
|
|
Retail GAAP operating income
|
|
$ |
(10,529 |
) |
|
$ |
(1,738 |
) |
|
|
(505.8% |
) |
|
Adjustments (pre-tax) *
|
|
|
12,606 |
|
|
|
243 |
|
|
|
|
|
|
Adjusted retail operating income *
|
|
$ |
2,077 |
|
|
$ |
(1,495 |
) |
|
|
238.9 |
% |
| |
|
|
|
|
|
|
|
|
|
|
|
|
|
Retail net sales
|
|
$ |
589,829 |
|
|
$ |
587,502 |
|
|
|
|
|
|
Retail GAAP operating margin
|
|
|
(1.8% |
) |
|
|
(0.3% |
) |
|
|
|
|
|
Adjusted retail operating margin *
|
|
|
0.4 |
% |
|
|
(0.3% |
) |
|
|
|
|
* Adjustments to reported U.S. GAAP financial measures including gross profit and margin, operating income and margin, net income, and diluted EPS have been adjusted by the following (in thousands):
| |
|
Fiscal Year Ended June 30,
|
|
| |
|
2019
|
|
|
2018
|
|
|
Inventory write-downs and manufacturing overhead costs
|
|
$ |
1,994 |
|
|
$ |
- |
|
|
Adjustments to gross profit
|
|
$ |
1,994 |
|
|
$ |
- |
|
| |
|
|
|
|
|
|
|
|
|
Restructuring charges, including inventory write-downs (wholesale)
|
|
$ |
8,324 |
|
|
$ |
- |
|
|
Impairment of long-lived assets, including lease exit costs (retail)
|
|
|
12,050 |
|
|
|
- |
|
|
Contingent legal claim (wholesale)
|
|
|
- |
|
|
|
500 |
|
|
Wholesale other exit costs (wholesale)
|
|
|
174 |
|
|
|
535 |
|
|
Retail acquisition and other exit costs (retail)
|
|
|
556 |
|
|
|
243 |
|
|
Adjustments to operating income
|
|
$ |
21,104 |
|
|
$ |
1,278 |
|
|
Early debt extinguishment
|
|
|
- |
|
|
|
67 |
|
|
Adjustments to income before income taxes
|
|
$ |
21,104 |
|
|
$ |
1,345 |
|
|
Related income tax effects(1)
|
|
|
(5,170 |
) |
|
|
(410 |
) |
|
Adjustments to net income
|
|
$ |
15,934 |
|
|
$ |
935 |
|
|
(1)
|
Calculated using an effective tax rate of 24.5% in fiscal 2019 and 30.5% in fiscal 2018.
|
Liquidity
At June 30, 2019, we held cash and equivalents of $20.8 million compared with $22.4 million at June 30, 2018. Our principal sources of liquidity include cash and cash equivalents, cash flow from operations and amounts available under our credit facility. Cash and cash equivalents aggregated to 4.1% of our total assets at June 30, 2019, compared with 4.2% of our total assets a year ago. Our cash and cash equivalents decreased $1.5 million during fiscal 2019 due to $47.0 million in dividend payments and $9.1 million of capital expenditures partially offset by net cash provided by operating activities of $55.2 million.
ETHAN ALLEN INTERIORS INC. AND SUBSIDIARIES
A summary of net cash provided by (used in) operating, investing and financing activities for each of the last three fiscal years is provided below (in millions):
| |
|
Fiscal Years Ended June 30,
|
|
| |
|
2019
|
|
|
2018
|
|
|
|
2017
|
|
|
Cash provided by (used in) operating activities
|
|
|
|
|
|
|
|
|
|
|
|
|
|
|
Net income plus other non-cash items
|
|
$ |
60.2 |
|
|
$ |
57.0 |
|
|
|
$ |
62.1 |
|
|
Change in working capital
|
|
|
(5.0 |
) |
|
|
(14.5 |
) |
|
|
|
16.5 |
|
|
Total provided by operating activities
|
|
$ |
55.2 |
|
|
$ |
42.5 |
|
|
|
$ |
78.6 |
|
| |
|
|
|
|
|
|
|
|
|
|
|
|
|
|
Cash provided by (used in) investing activities
|
|
|
|
|
|
|
|
|
|
|
|
|
|
|
Capital expenditures
|
|
$ |
(9.1 |
) |
|
$ |
(12.5 |
) |
|
|
$ |
(17.6 |
) |
|
Acquisitions, net of cash acquired
|
|
|
(0.5 |
) |
|
|
(6.3 |
) |
|
|
|
(0.7 |
) |
|
Other investing activities
|
|
|
0.1 |
|
|
|
0.6 |
|
|
|
|
1.4 |
|
|
Total (used in) investing activities
|
|
$ |
(9.5 |
) |
|
$ |
(18.2 |
) |
|
|
$ |
(16.9 |
) |
| |
|
|
|
|
|
|
|
|
|
|
|
|
|
|
Cash provided by (used in) financing activities
|
|
|
|
|
|
|
|
|
|
|
|
|
|
|
Payments on borrowings and capital lease obligations
|
|
$ |
(16.6 |
) |
|
$ |
(14.5 |
) |
|
|
$ |
(28.4 |
) |
|
Borrowings from revolving credit facility
|
|
|
16.0 |
|
|
|
- |
|
|
|
|
- |
|
|
Purchases and retirements of company stock
|
|
|
- |
|
|
|
(23.1 |
) |
|
|
|
(10.2 |
) |
|
Payment of cash dividends
|
|
|
(47.0 |
) |
|
|
(29.5 |
) |
|
|
|
(20.0 |
) |
|
Other financing activities
|
|
|
0.3 |
|
|
|
0.2 |
|
|
|
|
1.3 |
|
|
Total (used in) financing activities
|
|
$ |
(47.3 |
) |
|
$ |
(66.9 |
) |
|
|
$ |
(57.3 |
) |
Cash Provided By (Used in) Operating Activities. In fiscal 2019 cash generated from operations totaled $55.2 million, an increase of $12.7 million. This was largely due to $9.5 million in working capital improvements as fiscal 2018 experienced a significant inventory increase to support the order backlog and the expansion of our GSA business. In fiscal 2019, our inventory levels declined by $0.6 million while the year ago balance grew by $13.5 million. Partially offsetting the benefits of reduced inventory amounts was a reduction in customer deposits of $4.5 million, which negatively impacted cash flow. Lower customer deposits were due to written orders in the fourth quarter of fiscal 2019 being 4.0% lower than the year ago fourth quarter.
Cash Provided by (Used in) Investing Activities. In fiscal 2019, cash of $9.5 million was used in investing activities, a decrease of $8.7 million due to lower capital expenditures and design center acquisitions. Cash paid to acquire design centers from our independent retailers in an arm’s length transaction totaled $0.5 million during fiscal 2019 compared with $6.3 million a year ago. Effective July 1, 2018, and further described in Note 5 to the consolidated financial statements included under Part II, Item 8 of this Annual Report on Form 10-K, we consider restricted cash as a component of cash and cash equivalents as presented on our consolidated statement of cash flows. Previously the net change in restricted cash was considered an investing activity. Prior periods have been reclassified to conform to current year presentation.
Cash Provided By (Used in) Financing Activities. In fiscal 2019, $47.3 million was used in financing activities, which is $19.6 million less cash used than the $66.9 million of cash used in the prior year comparable period. The decrease year over year was primarily due to $23.1 million in share repurchases during fiscal 2018 (which included $22.0 million under our existing share repurchase program) compared to none in fiscal 2019. During fiscal 2019 we paid cash dividends of $47.0 million compared with $29.5 million in the prior year to date period. In November 2018, we declared a $1.00 per share special cash dividend, which was paid in January 2019, in addition to the regular quarterly dividend of $0.19 per share. We have continuously paid regular quarterly dividends for every quarter since 1996 and expect to continue to do so as economic conditions and liquidity permit. This year our total dividends paid to shareholders grew by 59.2%.
We believe that our cash flow from operations, together with our other available sources of liquidity including the credit facility, will be sufficient to fund changes in working capital, necessary capital expenditures, acquisition activity, repayment of debt, the payment of dividends and other cash requirements.
For a discussion of our liquidity and capital resources as of and our cash flow activities for the fiscal year ended June 30, 2018 and 2017, see Item 7, Management’s Discussion and Analysis of Financial Condition and Results of Operations, of our Annual Report on Form 10-K for the fiscal year ended June 30, 2018, filed with the SEC on August 2, 2018.
ETHAN ALLEN INTERIORS INC. AND SUBSIDIARIES
Capital Resources
Capital Expenditures. Capital expenditures in fiscal 2019 were $9.1 million compared with $12.5 million in the prior year period. The decrease of $3.4 million from the prior year related primarily to less spending on retail design center improvements. In fiscal 2019, approximately 65% of our total capital expenditures related to opening new and relocating design centers in desirable locations, updating presentations and floor plans and the consolidation of certain design centers and service centers. In fiscal 2018, approximately 75% of our capital expenditures were within the retail segment. We anticipate that cash from operations will be sufficient to fund future capital expenditures.
Capital Needs. During December 2018 we entered into a five-year, $165 million senior secured revolving credit facility, which amended and restated the previously existing facility. To partially fund the special cash dividend paid to shareholders in January 2019, we borrowed $16.0 million from the revolving credit facility. By June 30, 2019, we had repaid 100% of the total borrowed from cash generated from operating activities. For a detailed discussion of revolving credit facility, our debt obligations and timing of our related cash payments see Note 11 to the consolidated financial statements included under Part II, Item 8 of this Annual Report on Form 10-K.
Letters of Credit. At June 30, 2019 and 2018, there was $6.1 million and $6.2 million, respectively, of standby letters of credit outstanding under the revolving credit facility.
Total availability under the revolving credit facility was $158.9 million at June 30, 2019 and $108.8 million at June 30, 2018. At both June 30, 2019 and 2018, respectively, we were in compliance with all the covenants under the revolving credit facility.
For a discussion of our liquidity and capital resources as of and our cash flow activities for the fiscal year ended June 30, 2018 and 2017, see Item 7, Management’s Discussion and Analysis of Financial Condition and Results of Operations, of our Annual Report on Form 10-K for the fiscal year ended June 30, 2018, filed with the SEC on August 2, 2018.
Share Repurchase Program
We may from time to time make repurchases in the open market and through privately negotiated transactions, subject to market conditions, including pursuant to our previously announced repurchase program. There were no share repurchases under the program during fiscal 2019. During fiscal 2018, we repurchased 950,484 shares for $22.0 million under the existing share repurchase program. At June 30, 2019, we had a remaining Board authorization to repurchase 2,518,046 shares of our common stock pursuant to our program.
Contractual Obligations
Fluctuations in our operating results, levels of inventory on hand, the timing of tax and other payments as well as necessary capital expenditures to support growth of our operations will impact our liquidity and cash flows in future periods. The impact of our contractual obligations on our liquidity and capital resources in future periods should be considered in conjunction with the factors mentioned here. As of June 30, 2019, we had total contractual obligations of $207.0 million, which was comparable to the prior year commitments of $218.0 million, reflecting no material changes during fiscal 2019.
The following table summarizes our significant contractual obligations as of June 30, 2019 and the corresponding impact that these obligations will have on our liquidity and cash flows in future periods (in millions):
| |
|
|
|
|
|
Payments Due by Period
|
|
| |
|
|
|
|
|
Less than
|
|
|
1-3 |
|
|
4-5 |
|
|
More than
|
|
| |
|
Total
|
|
|
1 Year
|
|
|
Years
|
|
|
Years
|
|
|
5 Years
|
|
|
Long-term debt obligations(1)
|
|
$ |
- |
|
|
$ |
- |
|
|
$ |
- |
|
|
$ |
- |
|
|
$ |
- |
|
|
Capital lease obligations(2)
|
|
|
1.1 |
|
|
|
0.6 |
|
|
|
0.5 |
|
|
|
- |
|
|
|
- |
|
|
Operating lease obligations(3)
|
|
|
169.9 |
|
|
|
33.8 |
|
|
|
57.0 |
|
|
|
35.6 |
|
|
|
43.5 |
|
|
Purchase obligations(4)
|
|
|
35.8 |
|
|
|
32.0 |
|
|
|
3.8 |
|
|
|
- |
|
|
|
- |
|
|
Other long-term liabilities
|
|
|
0.2 |
|
|
|
- |
|
|
|
- |
|
|
|
- |
|
|
|
0.2 |
|
|
Total contractual obligations(5)
|
|
$ |
207.0 |
|
|
$ |
66.4 |
|
|
$ |
61.3 |
|
|
$ |
35.6 |
|
|
$ |
43.7 |
|
|
(1)
|
Long-term debt obligations mean all payment obligations under long-term borrowings. As of June 30, 2019, we did not have any outstanding borrowings under our revolving credit facility. Further discussion of our contractual obligations associated with long-term debt can be found in Note 11, Debt, in the notes to the Consolidated Financial Statements included in Item 8 of this Annual Report on Form 10-K.
|
|
(2)
|
Capital lease amounts include all future payment obligations under a lease classified as a capital lease pursuant to FASB ASC Topic 840.
|
|
(3)
|
Operating lease amounts include future minimum lease payments under all our non-cancelable operating leases with an initial term in excess of one year. For more information on our operating leases, see Note 20, Commitments and Contingencies, in the notes to the Consolidated Financial Statements included in Item 8 of this Annual Report on Form 10-K.
|
ETHAN ALLEN INTERIORS INC. AND SUBSIDIARIES
|
(4)
|
Purchase obligations are defined as agreements that are enforceable and legally binding that specify all significant terms, including fixed or minimum quantities to be purchased; fixed, minimum or variable price provisions; and the approximate timing of the transaction. We do, in the normal course of business, regularly initiate purchase orders for the procurement of (i) selected finished goods sourced from third-party suppliers, (ii) lumber, fabric, leather and other raw materials used in production, and (iii) certain outsourced services. All purchase orders are based on current needs and are fulfilled by suppliers within short time periods. At June 30, 2019, our open purchase orders with respect to such goods and services totaled $23.9 million and are to be paid in less than one year. Other purchase commitments included within this table represent payment due for other services such as telecommunication, computer-related software, royalties, web development, insurance and other maintenance contracts.
|
|
(5)
|
Non-current income taxes payable of $1.6 million and non-current deferred tax liabilities of $1.1 million have been excluded from the table above due to uncertainty regarding the timing of future payments.
|
We believe that our cash flow from operations, together with our other available sources of liquidity, will be adequate to make all required payments of principal and interest on our debt, to permit anticipated capital expenditures, and to fund working capital and other cash requirements. As of June 30, 2019, we had working capital of $93.5 million compared to $93.2 million at June 30, 2018, an increase of $0.3 million and a current ratio of 1.76 at June 30, 2019 compared to 1.77 at June 30, 2018. In addition to using available cash to fund changes in working capital, capital expenditures, retail acquisitions, repayment of debt, and payment of cash dividends, the Company has been authorized by our Board of Directors to repurchase shares of our common stock from time to time, either directly or through agents, in the open market at prices and on terms satisfactory to us.
Off-Balance Sheet Arrangements and Other Commitments and Contingencies
Except as indicated below, we do not utilize or employ any off-balance sheet arrangements, including special-purpose entities, in operating our business. As such, we do not maintain any (i) retained or contingent interests, (ii) derivative instruments (other than as specified below), or (iii) variable interests which could serve as a source of potential risk to our future liquidity, capital resources and results of operations.
We may, from time to time in the ordinary course of business, provide guarantees on behalf of selected affiliated entities or become contractually obligated to perform in accordance with the terms and conditions of certain business agreements. The nature and extent of these guarantees and obligations may vary based on our underlying relationship with the benefiting party and the business purpose for which the guarantee or obligation is being provided. The only such program in place at both June 30, 2019 and 2018, respectively, was for our legacy consumer credit program described below.
Ethan Allen Consumer Credit Program. The terms and conditions of our legacy consumer credit program, which is financed and administered by a third-party financial institution on a non-recourse basis to Ethan Allen, are set forth in an agreement between the Company and that financial service provider (the “Program Agreement”) which was last amended effective January 2014. Any independent retailer choosing to participate in the consumer credit program is required to enter into a separate agreement with that same third-party financial institution which sets forth the terms and conditions under which the retailer is to perform in connection with its offering of consumer credit to its customers (the “Retailer Agreement”). We have obligated ourselves on behalf of any independent retailer choosing to participate in our consumer credit program by agreeing, in the event of default, breach, or failure of the independent retailer to perform under such Retailer Agreement, to take on certain responsibilities of the independent retailer, including, but not limited to, delivery of goods and reimbursement of customer deposits. Customer receivables originated by independent retailers remain non-recourse to Ethan Allen. While the maximum potential amount of future payments (undiscounted) that we could be required to make under this obligation is indeterminable, recourse provisions exist that would enable us to recover, from the independent retailer, any amount paid or incurred by us related to our performance. Based on the underlying creditworthiness of our independent retailers, including their historical ability to perform satisfactorily in connection with the terms of our consumer credit program, we believe this obligation will expire without requiring funding by us. To ensure funding for delivery of products sold, the terms of the Program Agreement also contain a right for the financial services provider to demand from the Company collateral at a variable rate based on the volume of program sales if the Company does not meet certain covenants, including a minimum working capital requirement. At June 30, 2019 and 2018, we were in compliance with all such covenants. The Program Agreement and legacy consumer credit program will terminate on July 31, 2019.
During the fourth quarter of fiscal 2019, we launched a new consumer credit program utilizing a non-related third-party financial institution. Our new Ethan Allen Platinum consumer credit program, designed to make the Ethan Allen brand accessible to everyone, had a successful national launch and should continue to attract both new prospects and returning clients. Financing offered through this program is administered by a third-party financial institution and is granted to our clients on a non-recourse basis to the Company.
ETHAN ALLEN INTERIORS INC. AND SUBSIDIARIES
Product Warranties. Our products, including our case goods, upholstery and home accents, generally carry explicit product warranties and are provided based on terms that are generally accepted in the industry. All our domestic independent retailers are required to enter into and perform in accordance with the terms and conditions of a warranty service agreement. We record provisions for estimated warranty and other related costs at time of sale based on historical warranty loss experience and make periodic adjustments to those provisions to reflect actual experience. On rare occasion, certain warranty and other related claims involve matters of dispute that ultimately are resolved by negotiation, arbitration or litigation. In certain cases, a material warranty issue may arise which is beyond the scope of our historical experience. We provide for such warranty issues as they become known and are deemed to be both probable and estimable. It is reasonably possible that, from time to time, additional warranty and other related claims could arise from disputes or other matters beyond the scope of our historical experience. As of June 30, 2019 and 2018, our product warranty liability totaled $1.6 million and $1.5 million, respectively.
Dividends
In January 2019, we paid a $1.00 per share special cash dividend, in addition to the regular quarterly dividend of $0.19 per share. For the full fiscal 2019 year, we paid a total of $1.76 per share in dividends for an aggregate total of $47.0 million. In the prior year, total dividends paid were $29.5 million.
With our dividends, we have returned $126.5 million to shareholders over the past five years. Future cash dividends will depend on our earnings, capital requirements, financial condition and other factors considered relevant by us, subject to final determination by our Board of Directors.
Foreign Currency
Foreign Currency Exposure. Foreign currency exchange risk is primarily limited to our operation of Ethan Allen operated retail design centers located in Canada and our manufacturing plants in Mexico and Honduras, as substantially all purchases of imported parts and finished goods are denominated in U.S. dollars. The financial statements of these foreign locations are translated into U.S. dollars using period-end rates of exchange for assets and liabilities and average rates for the period for revenues and expenses. Translation gains and losses that arise from translating assets, liabilities, revenues and expenses of foreign operations are recorded in accumulated other comprehensive (loss) income as a component of shareholders’ equity. Foreign exchange gains or losses resulting from market changes in the value of foreign currencies did not have a material impact during any of the fiscal periods presented in this Annual Report on Form 10-K.
Impact of Inflation. We believe any inflationary impact on our product and operating costs during the past three fiscal years was offset by our ability to create operational efficiencies, seek lower cost alternatives and raise selling prices.
Critical Accounting Estimates
We prepare our consolidated financial statements in conformity with U.S. GAAP. In some cases, these principles require management to make difficult and subjective judgments regarding uncertainties and, as a result, such estimates and assumptions may significantly impact our financial results and disclosures. We consider an accounting estimate to be critical if: (i) the accounting estimate requires us to make assumptions about matters that were highly uncertain at the time the accounting estimate was made, and (ii) changes in the estimate that are reasonably likely to occur from period to period, or use of different estimates that we reasonably could have used in the current period, would have a material impact on our financial condition or results of operations. We base our estimates on currently known facts and circumstances, prior experience and other assumptions we believe to be reasonable. We use our best judgment in valuing these estimates and may, as warranted, use external advice. Actual results could differ from these estimates, assumptions, and judgments and these differences could be significant. We make frequent comparisons throughout the year of actual experience to our assumptions to reduce the likelihood of significant adjustments and will record adjustments when differences are known.
ETHAN ALLEN INTERIORS INC. AND SUBSIDIARIES
The following critical accounting estimates affect our consolidated financial statements.
Goodwill and Intangible Assets. Goodwill and other indefinite-lived intangible assets are evaluated for impairment on an annual basis during the fourth quarter of each fiscal year, and between annual tests whenever events or circumstances indicate that the carrying value of the goodwill or other indefinite-lived intangible asset may exceed its fair value. When testing goodwill for impairment, we may assess qualitative factors for some or all of our reporting units to determine whether it is more likely than not (that is, a likelihood of more than 50%) that the fair value of a reporting unit is less than its carrying amount, including goodwill. Alternatively, we may bypass this qualitative assessment and determine whether the carrying value exceeds the fair value using a quantitative assessment.
We also annually evaluate whether our trade name continues to have an indefinite life. Our trade name is reviewed for impairment annually in the fourth quarter and may be reviewed more frequently if indicators of impairment are present. Conditions that may indicate impairment include, but are not limited to, a significant adverse change in customer demand or business climate that could affect the value of an asset, a product recall or an adverse action or assessment by a regulator. We qualitatively assess indefinite-lived intangible asset impairment to determine whether it is more likely than not that the fair value of the asset is less than its carrying amount. If our trade name is qualitatively assessed and determined it is not more likely than not that the asset’s fair value is greater than its carrying amount, an impairment review is performed by comparing the carrying value to the estimated fair value, determined using a discounted cash flow methodology. Factors used in the valuation of intangible assets with indefinite lives include, but are not limited to, management’s plans for future operations, recent results of operations and projected future cash flows.
Impairment of Long-lived Assets. The recoverability of long-lived assets is evaluated for impairment at least annually or whenever events or changes in circumstances indicate that we may not be able to recover the carrying amount of an asset or asset group. Our assessment of recoverability determines whether the carrying value will be recovered through the expected undiscounted future cash flows resulting from the use of the asset. In the event the sum of the expected undiscounted future cash flows is less than the carrying value of the asset, an impairment loss equal to the excess of the asset’s carrying value over its fair value is recorded. For retail design center level long-lived assets, expected cash flows are determined based on our estimate of future net sales, margin rates and expenses over the remaining expected terms of the leases. Impairment, if any, is recorded in the period in which the impairment occurred.
Inventories. Inventories (finished goods, work in process and raw materials) are stated at the lower of cost, determined on a first-in, first-out basis, and net realizable value. Cost is determined based solely on those charges incurred in the acquisition and production of the related inventory (i.e. material, labor and manufacturing overhead costs). We estimate an inventory reserve for excess quantities and obsolete items based on specific identification and historical write-downs, taking into account future demand and market conditions. If actual demand or market conditions in the future are less favorable than those estimated, additional inventory write-downs may be required.
Income Taxes. We are subject to income taxes in the United States and other foreign jurisdictions. Our tax provision is an estimate based on our understanding of laws in Federal, state and foreign tax jurisdictions. These laws can be complicated and are difficult to apply to any business, including ours. The tax laws also require us to allocate our taxable income to many jurisdictions based on subjective allocation methodologies and information collection processes.
Deferred tax assets and liabilities are recognized for the future tax consequences attributable to differences between the financial statement carrying amounts of existing assets and liabilities and their respective tax bases and operating loss and tax credit carryforwards. Deferred tax assets and liabilities are measured using enacted tax rates expected to apply to taxable income in the years in which those temporary differences are expected to be recovered or settled. The effect on deferred tax assets and liabilities of a change in tax rates is recognized in income in the period that includes the enactment date. Additional factors that we consider when making judgments about the deferred tax valuation include tax law changes, a recent history of cumulative losses, and variances in future projected profitability.
ETHAN ALLEN INTERIORS INC. AND SUBSIDIARIES
The Company evaluates, on a quarterly basis, uncertain tax positions taken or expected to be taken on tax returns for recognition, measurement, presentation, and disclosure in its financial statements. If an income tax position exceeds a 50% probability of success upon tax audit, based solely on the technical merits of the position, the Company recognizes an income tax benefit in its financial statements. The tax benefits recognized are measured based on the largest benefit that has a greater than 50% likelihood of being realized upon ultimate settlement. The liability associated with an unrecognized tax benefit is classified as a long-term liability except for the amount for which a cash payment is expected to be made or tax positions settled within one year.
Business Insurance Reserves. We have insurance programs in place to cover workers’ compensation and property/casualty claims. The insurance programs, which are funded through self-insured retention, are subject to various stop-loss limitations. We accrue estimated losses using actuarial models and assumptions based on historical loss experience. Although we believe that the insurance reserves are adequate, the reserve estimates are based on historical experience, which may not be indicative of current and future losses. In addition, the actuarial calculations used to estimate insurance reserves are based on numerous assumptions, some of which are subjective. We adjust insurance reserves, as needed, in the event that future loss experience differs from historical loss patterns.
Recent Accounting Pronouncements
See Note 3, Summary of Significant Accounting Policies, in the notes to our consolidated financial statements included under Part II, Item 8, for a full description of recent accounting pronouncements, including the expected dates of adoption, which we include here by reference.
Business Outlook
With our vertical enterprise well positioned, we maintain a cautiously optimistic outlook. Our retail strategy will continue with its focus on (i) providing relevant product offerings, a wide array of product solutions, and superior interior design solutions through our large staff of interior design professionals, (ii) continuing strong advertising and marketing campaigns to get our message across and to continue broadening our customer base, (iii) the opening of new or relocated design centers in more prominent locations, and encouraging independent retailers to do the same, (iv) leveraging the use of technology and personal service within our retail network and online through ethanallen.com, and (v) further expansion internationally. We believe this strategy provides an opportunity to grow our business.
We continue to strengthen our vertically integrated structure from concept of idea, to engineering, to manufacturing, to retail and logistics. We intend to maintain strong manufacturing capabilities in North America, which we believe is a long-term competitive advantage that will allow us to advance our objectives of maintaining fast order delivery, exceptional quality and improving capacity to ship stocked and custom made-to-order items more quickly, which in turn will allow us to grow our business.
We have completed a major transformation of our product offerings, which reflect fresh and relevant styling targeted to a wide demographic base. Our design centers continue to be optimized, both in location and size, to build traffic and increase sales. In addition to expanding our retail channels, we continue to leverage our manufacturing capacities to expand our contract sales with GSA-related governmental agencies and the military as well as with other contract customers, including those in the hospitality industry.
Our network of professionally trained interior design professionals differentiates us significantly from our competitors. We continue to strengthen the level of service, professionalism, and interior design competence, as well as to improve the efficiency of our retail operations. We believe that over time, we will continue to benefit from (i) continuous repositioning of our retail network, (ii) frequent new product introductions, (iii) new and innovative marketing promotions and effective use of targeted advertising media, and (iv) continued use of the latest technology combined with personal service from our interior design professionals.
We expect the home furnishings industry to remain extremely competitive with respect to both the sourcing of products and the wholesale and retail sale of those products for the foreseeable future. Domestic manufacturers continue to face pricing pressures because of the lower manufacturing costs on imports, particularly from Asia. While we also utilize overseas sourcing for approximately 25% of our products, we choose to differentiate ourselves by maintaining a substantial North American manufacturing base, the majority of which is located in the United States. This structure enables us to leverage our vertically integrated structure to our advantage. We continue to believe that a balanced approach to product sourcing, which includes our own North American manufacturing of approximately 75% of our product offerings coupled with the import of other selected products, provides the greatest degree of flexibility, lower inventory levels, and short lead times and is the most effective approach to ensuring that acceptable levels of quality and service are maintained.
ETHAN ALLEN INTERIORS INC. AND SUBSIDIARIES
ITEM 7A. QUANTITATIVE AND QUALITATIVE DISCLOSURES ABOUT MARKET RISK
In the normal course of business, we are exposed to market risks relating to fluctuations in interest rates and foreign currency exchange rates that could impact our financial position and results of operations.
Interest Rate Risk
Debt. Interest rate risk exists primarily through our borrowing activities. We utilize U.S. dollar denominated borrowings to fund substantially all our working capital and investment needs. Short-term debt, if required, is used to meet working capital requirements and long-term debt is generally used to finance long-term investments. There is inherent rollover risk for borrowings as they mature and are renewed at current market rates. The extent of this risk is not quantifiable or predictable because of the variability of future interest rates and our future financing requirements. For floating-rate obligations, interest rate changes do not affect the fair value of the underlying financial instrument but would impact future earnings and cash flows, assuming other factors are held constant. Conversely, for fixed-rate obligations, interest rate changes affect the fair value of the underlying financial instrument but would not impact earnings or cash flows.
At June 30, 2019, we did not have any floating-rate debt obligations outstanding under our revolving credit facility. It is anticipated that the fair market value of any future debt under the credit facility will continue to be immaterially affected by fluctuations in interest rates and we do not believe that the value of such debt would be significantly impacted by current market events. Previous borrowings under the facility during fiscal 2019 had an interest rate equal to the one-month LIBOR rate of 2.5% plus a spread using a debt leverage pricing grid currently at 1.5%. During fiscal 2019, we recorded interest expense of $0.2 million on our borrowings. We currently do not engage in any interest rate hedging activity and we have no intention of doing so in the foreseeable future. Assuming all terms of our outstanding long-term debt remained the same, a hypothetical 100 basis point change (up or down) in the one-month LIBOR rate would not have a material affect on our consolidated results of operations and financial condition.
LIBOR Transition. LIBOR is the subject of recent national, international and other regulatory guidance and proposals for reform. These reforms and other pressure may cause LIBOR to disappear entirely or to perform differently than in the past. It is expected that certain banks will stop reporting information used to set LIBOR at the end of 2021 when their reporting obligations cease. This will effectively end the usefulness of LIBOR and may end its publication. The consequences of these developments cannot be entirely predicted but, as noted above, could impact the interest earned on our investments and our interest expense. If LIBOR is no longer widely available, or otherwise at our option, we will pursue alternative interest rate calculations in our credit agreement. As of June 30, 2019 and 2018, the Company had no outstanding borrowings under its existing credit facility and no material exposure to LIBOR, thus we do not believe the discontinuation of LIBOR will have a material impact on our financial position and results of operations.
Cash and Cash Equivalents. The fair market value of our cash and cash equivalents at June 30, 2019 was $20.8 million. Our cash and cash equivalents consist of demand deposits and money market funds with original maturities of three months or less and are reported at fair value. It is anticipated that the fair market value of our cash equivalents will continue to be immaterially affected by fluctuations in interest rates. Preservation of principal is the primary goal of our cash and investment policy. Pursuant to our established investment guidelines, we try to achieve high levels of credit quality, liquidity and diversification. Because of our investment policy, our financial exposure to fluctuations in interest rates is expected to remain low. We do not believe that the value or liquidity of our cash and cash equivalents have been significantly impacted by current market events.
Foreign Currency Exchange Risk
Foreign currency exchange risk is primarily limited to our operation of Ethan Allen operated retail design centers located in Canada and our manufacturing plants in Mexico and Honduras, as substantially all purchases of imported parts and finished goods are denominated in United States dollars. As such, foreign exchange gains or losses resulting from market changes in the value of foreign currencies have not had, nor are they expected to have, a material affect on our consolidated results of operations. A decrease in the value of foreign currencies relative to the U.S. dollar may affect the profitability of our vendors, but as we employ a balanced sourcing strategy, we believe any impact would be moderate relative to peers in our industry.
A hypothetical 10% weaker United States dollar against all foreign currencies at June 30, 2019 would have had an immaterial impact on our consolidated results of operations and financial condition. We currently do not engage in any foreign currency hedging activity and we have no intention of doing so in the foreseeable future.
ETHAN ALLEN INTERIORS INC. AND SUBSIDIARIES
ITEM 8. FINANCIAL STATEMENTS AND SUPPLEMENTARY DATA
Index to Consolidated Financial Statements and Supplementary Data
|
Consolidated Financial Statements
|
Page
|
| |
|
|
Management’s Report on Internal Control over Financial Reporting
|
36
|
| |
|
|
Report of Independent Registered Public Accounting Firm
|
37
|
| |
|
|
Consolidated Balance Sheets at June 30, 2019 and 2018
|
39
|
| |
|
|
Consolidated Statements of Comprehensive Income for the years ended June 30, 2019, 2018 and 2017
|
40
|
| |
|
|
Consolidated Statements of Cash Flows for the years ended June 30, 2019, 2018 and 2017
|
41
|
| |
|
|
Consolidated Statements of Shareholders’ Equity for the years ended June 30, 2019, 2018 and 2017
|
42
|
| |
|
|
Notes to the Consolidated Financial Statements
|
43
|
ETHAN ALLEN INTERIORS INC. AND SUBSIDIARIES
Management’s Report on Internal Control Over Financial Reporting
Our management is responsible for establishing and maintaining adequate internal control over financial reporting, as such term is defined in Rule 13a-15(f) of the Exchange Act. Our internal control over financial reporting is a process designed to provide reasonable assurance regarding the reliability of financial reporting and the preparation of financial statements for external purposes in accordance with U.S. GAAP.
Our internal control over financial reporting includes those policies and procedures that:
| |
●
|
pertain to the maintenance of records that, in reasonable detail, accurately and fairly reflect the transactions and dispositions of our assets;
|
| |
●
|
provide reasonable assurance that transactions are recorded as necessary to permit preparation of financial statements in accordance with U.S. GAAP, and that our receipts and expenditures are being made only in accordance with authorizations of our management and directors; and
|
| |
●
|
provide reasonable assurance regarding prevention or timely detection of unauthorized acquisition, use, or disposition of our assets that could have a material affect on our financial statements.
|
Management has assessed the effectiveness of our internal control over financial reporting based on the framework in “Internal Control – Integrated Framework (2013)” issued by the Committee of Sponsoring Organizations of the Treadway Commission.
Based on the above evaluation, management has concluded that our internal control over financial reporting was effective as of June 30, 2019 to provide reasonable assurance regarding the reliability of financial reporting and the preparation of consolidated financial statements for external reporting purposes in accordance with U.S. GAAP. The effectiveness of our internal control over financial reporting as of June 30, 2019 has been audited by KPMG LLP, an independent registered public accounting firm, as stated in their report, which is included herein.
|
/s/ M. Farooq Kathwari
|
/s/ Corey Whitely
|
|
Chairman, President and
|
Executive Vice President, Administration
|
|
Chief Executive Officer
|
Chief Financial Officer and Treasurer
|
|
(Principal Executive Officer)
|
(Principal Financial Officer)
|
ETHAN ALLEN INTERIORS INC. AND SUBSIDIARIES
Report of Independent Registered Public Accounting Firm
To the Shareholders and Board of Directors
Ethan Allen Interiors Inc.:
Opinions on the Consolidated Financial Statements and Internal Control Over Financial Reporting
We have audited the accompanying consolidated balance sheets of Ethan Allen Interiors Inc. and subsidiaries (the “Company”) as of June 30, 2019 and 2018, the related consolidated statements of comprehensive income, shareholders’ equity, and cash flows for each of the years in the three-year period ended June 30, 2019, and the related notes (collectively, the “consolidated financial statements”). We also have audited the Company’s internal control over financial reporting as of June 30, 2019, based on criteria established in Internal Control – Integrated Framework (2013) issued by the Committee of Sponsoring Organizations of the Treadway Commission.
In our opinion, the consolidated financial statements referred to above present fairly, in all material respects, the financial position of the Company as of June 30, 2019 and 2018, and the results of its operations and its cash flows for each of the years in the three-year period ended June 30, 2019, in conformity with U.S. generally accepted accounting principles. Also in our opinion, the Company maintained, in all material respects, effective internal control over financial reporting as of June 30, 2019, based on criteria established in Internal Control – Integrated Framework (2013) issued by the Committee of Sponsoring Organizations of the Treadway Commission.
Basis for Opinions
The Company’s management is responsible for these consolidated financial statements, for maintaining effective internal control over financial reporting, and for its assessment of the effectiveness of internal control over financial reporting, included in the accompanying Management’s Report on Internal Control Over Financial Reporting. Our responsibility is to express an opinion on the Company’s consolidated financial statements and an opinion on the Company’s internal control over financial reporting based on our audits. We are a public accounting firm registered with the Public Company Accounting Oversight Board (United States ) (“PCAOB”) and are required to be independent with respect to the Company in accordance with the U.S. federal securities laws and the applicable rules and regulations of the Securities and Exchange Commission and the PCAOB.
We conducted our audits in accordance with the standards of the PCAOB. Those standards require that we plan and perform the audits to obtain reasonable assurance about whether the consolidated financial statements are free of material misstatement, whether due to error or fraud, and whether effective internal control over financial reporting was maintained in all material respects.
Our audits of the consolidated financial statements included performing procedures to assess the risks of material misstatement of the consolidated financial statements, whether due to error or fraud, and performing procedures that respond to those risks. Such procedures included examining, on a test basis, evidence regarding the amounts and disclosures in the consolidated financial statements. Our audits also included evaluating the accounting principles used and significant estimates made by management, as well as evaluating the overall presentation of the consolidated financial statements. Our audit of internal control over financial reporting included obtaining an understanding of internal control over financial reporting, assessing the risk that a material weakness exists, and testing and evaluating the design and operating effectiveness of internal control based on the assessed risk. Our audits also included performing such other procedures as we considered necessary in the circumstances. We believe that our audits provide a reasonable basis for our opinions.
Definition and Limitations of Internal Control Over Financial Reporting
A company’s internal control over financial reporting is a process designed to provide reasonable assurance regarding the reliability of financial reporting and the preparation of financial statements for external purposes in accordance with generally accepted accounting principles. A company’s internal control over financial reporting includes those policies and procedures that (1) pertain to the maintenance of records that, in reasonable detail, accurately and fairly reflect the transactions and dispositions of the assets of the company; (2) provide reasonable assurance that transactions are recorded as necessary to permit preparation of financial statements in accordance with generally accepted accounting principles, and that receipts and expenditures of the company are being made only in accordance with authorizations of management and directors of the company; and (3) provide reasonable assurance regarding prevention or timely detection of unauthorized acquisition, use, or disposition of the company’s assets that could have a material affect on the financial statements.
ETHAN ALLEN INTERIORS INC. AND SUBSIDIARIES
Because of its inherent limitations, internal control over financial reporting may not prevent or detect misstatements. Also, projections of any evaluation of effectiveness to future periods are subject to the risk that controls may become inadequate because of changes in conditions, or that the degree of compliance with the policies or procedures may deteriorate.
/s/ KPMG LLP
We have served as the Company’s auditor since 1989.
Stamford, Connecticut
August 9, 2019
ETHAN ALLEN INTERIORS INC. AND SUBSIDIARIES
|
CONSOLIDATED BALANCE SHEETS
|
|
(In thousands, except par value)
|
| |
| |
|
June 30,
|
|
| |
|
2019
|
|
|
2018
|
|
|
ASSETS
|
|
|
|
|
|
|
|
|
|
Current assets:
|
|
|
|
|
|
|
|
|
|
Cash and cash equivalents
|
|
$ |
20,824 |
|
|
$ |
22,363 |
|
|
Accounts receivable, net
|
|
|
14,247 |
|
|
|
12,364 |
|
|
Inventories, net
|
|
|
162,389 |
|
|
|
163,012 |
|
|
Prepaid expenses and other current assets
|
|
|
18,830 |
|
|
|
16,686 |
|
|
Total current assets
|
|
|
216,290 |
|
|
|
214,425 |
|
| |
|
|
|
|
|
|
|
|
|
Property, plant and equipment, net
|
|
|
245,246 |
|
|
|
267,903 |
|
|
Goodwill
|
|
|
25,388 |
|
|
|
25,388 |
|
|
Intangible assets
|
|
|
19,740 |
|
|
|
19,740 |
|
|
Deferred income taxes
|
|
|
2,108 |
|
|
|
1,688 |
|
|
Other assets
|
|
|
1,579 |
|
|
|
1,289 |
|
|
TOTAL ASSETS
|
|
$ |
510,351 |
|
|
$ |
530,433 |
|
| |
|
|
|
|
|
|
|
|
|
LIABILITIES
|
|
|
|
|
|
|
|
|
|
Current liabilities:
|
|
|
|
|
|
|
|
|
|
Accounts payable and accrued expenses
|
|
$ |
35,485 |
|
|
$ |
33,288 |
|
|
Customer deposits
|
|
|
56,714 |
|
|
|
61,248 |
|
|
Accrued compensation and benefits
|
|
|
21,327 |
|
|
|
18,926 |
|
|
Short-term debt
|
|
|
550 |
|
|
|
584 |
|
|
Other current liabilities
|
|
|
8,750 |
|
|
|
7,214 |
|
|
Total current liabilities
|
|
|
122,826 |
|
|
|
121,260 |
|
|
Long-term debt
|
|
|
516 |
|
|
|
1,096 |
|
|
Deferred income taxes
|
|
|
1,069 |
|
|
|
4,160 |
|
|
Other long-term liabilities
|
|
|
22,011 |
|
|
|
20,047 |
|
|
TOTAL LIABILITIES
|
|
$ |
146,422 |
|
|
$ |
146,563 |
|
| |
|
|
|
|
|
|
|
|
|
Commitments and contingencies (See Note 20)
|
|
|
|
|
|
|
|
|
| |
|
|
|
|
|
|
|
|
|
SHAREHOLDERS' EQUITY
|
|
|
|
|
|
|
|
|
|
Preferred stock, $0.01 par value; 1,055 shares authorized; none issued
|
|
$ |
- |
|
|
$ |
- |
|
|
Common stock, $0.01 par value; 150,000 shares authorized; 49,049 and 48,989 shares issued; 26,587 and 26,529 shares outstanding at June 30, 2019 and 2018, respectively
|
|
|
491 |
|
|
|
490 |
|
|
Additional paid-in-capital
|
|
|
377,913 |
|
|
|
376,950 |
|
|
Treasury stock, at cost: 22,462 and 22,460 shares at June 30, 2019 and 2018, respectively
|
|
|
(656,597 |
) |
|
|
(656,551 |
) |
|
Retained earnings
|
|
|
647,710 |
|
|
|
669,013 |
|
|
Accumulated other comprehensive loss
|
|
|
(5,651 |
) |
|
|
(6,171 |
) |
|
Total Ethan Allen Interiors Inc. shareholders' equity
|
|
|
363,866 |
|
|
|
383,731 |
|
|
Noncontrolling interests
|
|
|
63 |
|
|
|
139 |
|
|
TOTAL SHAREHOLDERS' EQUITY
|
|
|
363,929 |
|
|
|
383,870 |
|
|
TOTAL LIABILITIES AND SHAREHOLDERS' EQUITY
|
|
$ |
510,351 |
|
|
$ |
530,433 |
|
|
See accompanying notes to consolidated financial statements.
|
ETHAN ALLEN INTERIORS INC. AND SUBSIDIARIES
|
CONSOLIDATED STATEMENTS OF COMPREHENSIVE INCOME
|
|
(In thousands, except share data)
|
| |
|
Years ended June 30,
|
|
| |
|
2019
|
|
|
2018
|
|
|
2017
|
|
|
Net sales
|
|
$ |
746,684 |
|
|
$ |
766,784 |
|
|
$ |
763,385 |
|
|
Cost of sales
|
|
|
337,193 |
|
|
|
350,820 |
|
|
|
343,662 |
|
|
Gross profit
|
|
|
409,491 |
|
|
|
415,964 |
|
|
|
419,723 |
|
| |
|
|
|
|
|
|
|
|
|
|
|
|
|
Selling, general and administrative
|
|
|
357,164 |
|
|
|
367,097 |
|
|
|
361,773 |
|
|
Restructuring and impairment charges
|
|
|
18,380 |
|
|
|
- |
|
|
|
- |
|
|
Operating income
|
|
|
33,947 |
|
|
|
48,867 |
|
|
|
57,950 |
|
| |
|
|
|
|
|
|
|
|
|
|
|
|
|
Interest (expense), net of interest income
|
|
|
(87 |
) |
|
|
200 |
|
|
|
(955 |
) |
|
Income before income taxes
|
|
|
33,860 |
|
|
|
49,067 |
|
|
|
56,995 |
|
| |
|
|
|
|
|
|
|
|
|
|
|
|
|
Provision for income taxes
|
|
|
8,162 |
|
|
|
12,696 |
|
|
|
20,801 |
|
|
Net Income
|
|
$ |
25,698 |
|
|
$ |
36,371 |
|
|
$ |
36,194 |
|
| |
|
|
|
|
|
|
|
|
|
|
|
|
|
Per share data:
|
|
|
|
|
|
|
|
|
|
|
|
|
|
Basic earnings per common share:
|
|
|
|
|
|
|
|
|
|
|
|
|
|
Net income per basic share
|
|
$ |
0.96 |
|
|
$ |
1.33 |
|
|
$ |
1.31 |
|
|
Basic weighted average common shares
|
|
|
26,695 |
|
|
|
27,321 |
|
|
|
27,679 |
|
|
Diluted earnings per common share:
|
|
|
|
|
|
|
|
|
|
|
|
|
|
Net income per diluted share
|
|
$ |
0.96 |
|
|
$ |
1.32 |
|
|
$ |
1.29 |
|
|
Diluted weighted average common shares
|
|
|
26,751 |
|
|
|
27,625 |
|
|
|
27,958 |
|
| |
|
|
|
|
|
|
|
|
|
|
|
|
|
Comprehensive income:
|
|
|
|
|
|
|
|
|
|
|
|
|
|
Net income
|
|
$ |
25,698 |
|
|
$ |
36,371 |
|
|
$ |
36,194 |
|
|
Other comprehensive income (loss), net of tax
|
|
|
|
|
|
|
|
|
|
|
|
|
|
Foreign curency translation adjustments
|
|
|
520 |
|
|
|
(2,040 |
) |
|
|
715 |
|
|
Other
|
|
|
(76 |
) |
|
|
(51 |
) |
|
|
(14 |
) |
|
Other comprehensive income (loss), net of tax
|
|
|
444 |
|
|
|
(2,091 |
) |
|
|
701 |
|
|
Comprehensive income
|
|
$ |
26,142 |
|
|
$ |
34,280 |
|
|
$ |
36,895 |
|
|
See accompanying notes to consolidated financial statements.
|
ETHAN ALLEN INTERIORS INC. AND SUBSIDIARIES
|
CONSOLIDATED STATEMENTS OF CASH FLOWS
|
|
(In thousands)
|
| |
|
Years ended June 30,
|
|
| |
|
2019
|
|
|
2018
|
|
|
2017
|
|
|
Cash Flows from Operating Activities
|
|
|
|
|
|
|
|
|
|
|
|
|
|
Net income
|
|
$ |
25,698 |
|
|
$ |
36,371 |
|
|
$ |
36,194 |
|
|
Adjustments to reconcile net income to net cash provided by operating activities:
|
|
|
|
|
|
|
|
|
|
|
|
|
|
Depreciation and amortization
|
|
|
19,637 |
|
|
|
19,831 |
|
|
|
20,115 |
|
|
Share-based compensation expense
|
|
|
121 |
|
|
|
954 |
|
|
|
1,259 |
|
|
Deferred income taxes
|
|
|
(3,511 |
) |
|
|
(106 |
) |
|
|
3,507 |
|
|
Restructuring and impairment charges
|
|
|
20,374 |
|
|
|
- |
|
|
|
- |
|
|
Payments for restructuring
|
|
|
(2,296 |
) |
|
|
- |
|
|
|
- |
|
|
Loss on disposal of property, plant and equipment
|
|
|
157 |
|
|
|
201 |
|
|
|
1,033 |
|
|
Other
|
|
|
115 |
|
|
|
(250 |
) |
|
|
(6 |
) |
|
Change in operating assets and liabilities, net of effects of acquisitions:
|
|
|
|
|
|
|
|
|
|
|
|
|
|
Accounts receivable, net
|
|
|
(565 |
) |
|
|
(682 |
) |
|
|
(2,826 |
) |
|
Inventories
|
|
|
957 |
|
|
|
(11,876 |
) |
|
|
13,507 |
|
|
Prepaid expenses and other current assets
|
|
|
(2,155 |
) |
|
|
3,274 |
|
|
|
1,010 |
|
|
Customer deposits
|
|
|
(4,924 |
) |
|
|
(2,444 |
) |
|
|
1,883 |
|
|
Accounts payable and accrued expenses
|
|
|
631 |
|
|
|
2,288 |
|
|
|
1,257 |
|
|
Accrued compensation and benefits
|
|
|
687 |
|
|
|
(1,426 |
) |
|
|
(1,715 |
) |
|
Other assets and liabilities
|
|
|
321 |
|
|
|
(3,638 |
) |
|
|
3,415 |
|
|
Net cash provided by operating activities
|
|
|
55,247 |
|
|
|
42,497 |
|
|
|
78,633 |
|
| |
|
|
|
|
|
|
|
|
|
|
|
|
|
Cash Flows from Investing Activities
|
|
|
|
|
|
|
|
|
|
|
|
|
|
Proceeds from the disposal of property, plant & equipment
|
|
|
1 |
|
|
|
327 |
|
|
|
1,273 |
|
|
Capital expenditures
|
|
|
(9,120 |
) |
|
|
(12,486 |
) |
|
|
(17,645 |
) |
|
Acquisitions, net of cash acquired
|
|
|
(534 |
) |
|
|
(6,287 |
) |
|
|
(676 |
) |
|
Other investing activities
|
|
|
153 |
|
|
|
204 |
|
|
|
175 |
|
|
Net cash used in investing activities
|
|
|
(9,500 |
) |
|
|
(18,242 |
) |
|
|
(16,873 |
) |
| |
|
|
|
|
|
|
|
|
|
|
|
|
|
Cash Flows from Financing Activities
|
|
|
|
|
|
|
|
|
|
|
|
|
|
Borrowings on revolving credit facility
|
|
|
16,000 |
|
|
|
- |
|
|
|
- |
|
|
Payments on borrowings and capital lease obligations
|
|
|
(16,578 |
) |
|
|
(14,456 |
) |
|
|
(28,401 |
) |
|
Repurchases of common stock
|
|
|
(46 |
) |
|
|
(23,120 |
) |
|
|
(10,246 |
) |
|
Payment of cash dividends
|
|
|
(46,990 |
) |
|
|
(29,509 |
) |
|
|
(20,031 |
) |
|
Other financing activities
|
|
|
276 |
|
|
|
194 |
|
|
|
1,335 |
|
|
Net cash used in financing activities
|
|
|
(47,338 |
) |
|
|
(66,891 |
) |
|
|
(57,343 |
) |
| |
|
|
|
|
|
|
|
|
|
|
|
|
|
Effect of exchange rate changes on cash and cash equivalents
|
|
|
52 |
|
|
|
(32 |
) |
|
|
135 |
|
|
Net (decrease) increase in cash, cash equivalents and restricted cash
|
|
|
(1,539 |
) |
|
|
(42,668 |
) |
|
|
4,552 |
|
|
Cash, cash equivalents and restricted cash at beginning of period
|
|
|
22,363 |
|
|
|
65,031 |
|
|
|
60,479 |
|
|
Cash, cash equivalents and restricted cash at end of period
|
|
$ |
20,824 |
|
|
$ |
22,363 |
|
|
$ |
65,031 |
|
| |
|
|
|
|
|
|
|
|
|
|
|
|
|
Supplemental Disclosure on Cash Flow Information
|
|
|
|
|
|
|
|
|
|
|
|
|
|
Cash paid during the year for income taxes, net of refunds
|
|
$ |
13,339 |
|
|
$ |
14,305 |
|
|
$ |
15,074 |
|
|
Cash paid during the year for interest
|
|
$ |
306 |
|
|
$ |
177 |
|
|
$ |
936 |
|
| |
|
|
|
|
|
|
|
|
|
|
|
|
|
Supplemental Disclosure on Non-Cash Information
|
|
|
|
|
|
|
|
|
|
|
|
|
|
Non-cash capital lease obligations incurred
|
|
$ |
- |
|
|
$ |
1,442 |
|
|
$ |
613 |
|
|
Dividends declared, not paid
|
|
$ |
5,075 |
|
|
$ |
5,065 |
|
|
$ |
5,239 |
|
|
See accompanying notes to consolidated financial statements.
|
ETHAN ALLEN INTERIORS INC. AND SUBSIDIARIES
|
CONSOLIDATED STATEMENTS OF SHAREHOLDERS' EQUITY
|
|
(In thousands)
|
| |
|
|
|
|
|
|
|
|
|
|
|
|
|
|
|
|
|
|
|
|
|
Accumulated
|
|
|
|
|
|
|
|
|
|
|
|
|
|
| |
|
|
|
|
|
|
|
|
|
Additional
|
|
|
|
|
|
|
|
|
|
|
Other
|
|
|
|
|
|
|
Non-
|
|
|
|
|
|
| |
|
Common Stock
|
|
|
Paid-in
|
|
|
Treasury Stock
|
|
|
Comprehensive
|
|
|
Retained
|
|
|
Controlling
|
|
|
Total
|
|
| |
|
Shares
|
|
|
Par Value
|
|
|
Capital
|
|
|
Shares
|
|
|
Amount
|
|
|
Loss
|
|
|
Earnings
|
|
|
Interests
|
|
|
Equity
|
|
|
Balance at June 30, 2016
|
|
|
48,922 |
|
|
$ |
489 |
|
|
$ |
374,972 |
|
|
|
21,176 |
|
|
$ |
(624,932 |
) |
|
$ |
(4,846 |
) |
|
$ |
646,315 |
|
|
$ |
204 |
|
|
$ |
392,202 |
|
|
Net income
|
|
|
- |
|
|
|
- |
|
|
|
- |
|
|
|
- |
|
|
|
- |
|
|
|
- |
|
|
|
36,194 |
|
|
|
- |
|
|
|
36,194 |
|
|
Common stock issued on share-based awards
|
|
|
58 |
|
|
|
1 |
|
|
|
1,199 |
|
|
|
- |
|
|
|
- |
|
|
|
- |
|
|
|
- |
|
|
|
- |
|
|
|
1,200 |
|
|
Share-based compensation expense
|
|
|
- |
|
|
|
- |
|
|
|
1,259 |
|
|
|
- |
|
|
|
- |
|
|
|
- |
|
|
|
- |
|
|
|
- |
|
|
|
1,259 |
|
|
Tax benefits from share-based payment arrangements
|
|
|
- |
|
|
|
- |
|
|
|
120 |
|
|
|
- |
|
|
|
- |
|
|
|
- |
|
|
|
- |
|
|
|
- |
|
|
|
120 |
|
|
Purchase/retirement of company stock
|
|
|
- |
|
|
|
- |
|
|
|
- |
|
|
|
357 |
|
|
|
(10,247 |
) |
|
|
- |
|
|
|
- |
|
|
|
- |
|
|
|
(10,247 |
) |
|
Cash dividends declared
|
|
|
- |
|
|
|
- |
|
|
|
- |
|
|
|
- |
|
|
|
- |
|
|
|
- |
|
|
|
(20,533 |
) |
|
|
- |
|
|
|
(20,533 |
) |
|
Other comprehensive income (loss)
|
|
|
- |
|
|
|
- |
|
|
|
- |
|
|
|
- |
|
|
|
- |
|
|
|
715 |
|
|
|
- |
|
|
|
(14 |
) |
|
|
701 |
|
|
Balance at June 30, 2017
|
|
|
48,980 |
|
|
$ |
490 |
|
|
$ |
377,550 |
|
|
|
21,533 |
|
|
$ |
(635,179 |
) |
|
$ |
(4,131 |
) |
|
$ |
661,976 |
|
|
$ |
190 |
|
|
$ |
400,896 |
|
|
Net income
|
|
|
- |
|
|
|
- |
|
|
|
- |
|
|
|
- |
|
|
|
- |
|
|
|
- |
|
|
|
36,371 |
|
|
|
- |
|
|
|
36,371 |
|
|
Common stock issued on share-based awards
|
|
|
9 |
|
|
|
- |
|
|
|
193 |
|
|
|
- |
|
|
|
- |
|
|
|
- |
|
|
|
- |
|
|
|
- |
|
|
|
193 |
|
|
Share-based compensation expense
|
|
|
- |
|
|
|
- |
|
|
|
954 |
|
|
|
- |
|
|
|
- |
|
|
|
- |
|
|
|
- |
|
|
|
- |
|
|
|
954 |
|
|
Purchase/retirement of company stock
|
|
|
- |
|
|
|
- |
|
|
|
(1,747 |
) |
|
|
927 |
|
|
|
(21,372 |
) |
|
|
- |
|
|
|
- |
|
|
|
- |
|
|
|
(23,119 |
) |
|
Cash dividends declared
|
|
|
- |
|
|
|
- |
|
|
|
- |
|
|
|
- |
|
|
|
- |
|
|
|
- |
|
|
|
(29,334 |
) |
|
|
- |
|
|
|
(29,334 |
) |
|
Other comprehensive income (loss)
|
|
|
- |
|
|
|
- |
|
|
|
- |
|
|
|
- |
|
|
|
- |
|
|
|
(2,040 |
) |
|
|
- |
|
|
|
(51 |
) |
|
|
(2,091 |
) |
|
Balance at June 30, 2018
|
|
|
48,989 |
|
|
$ |
490 |
|
|
$ |
376,950 |
|
|
|
22,460 |
|
|
$ |
(656,551 |
) |
|
$ |
(6,171 |
) |
|
$ |
669,013 |
|
|
$ |
139 |
|
|
$ |
383,870 |
|
|
Net income
|
|
|
- |
|
|
|
- |
|
|
|
- |
|
|
|
- |
|
|
|
- |
|
|
|
- |
|
|
|
25,698 |
|
|
|
- |
|
|
|
25,698 |
|
|
Common stock issued on share-based awards
|
|
|
52 |
|
|
|
1 |
|
|
|
842 |
|
|
|
- |
|
|
|
- |
|
|
|
- |
|
|
|
- |
|
|
|
- |
|
|
|
843 |
|
|
Share-based compensation expense
|
|
|
- |
|
|
|
- |
|
|
|
121 |
|
|
|
- |
|
|
|
- |
|
|
|
- |
|
|
|
- |
|
|
|
- |
|
|
|
121 |
|
|
Restricted stock vesting
|
|
|
8 |
|
|
|
- |
|
|
|
- |
|
|
|
2 |
|
|
|
(46 |
) |
|
|
- |
|
|
|
- |
|
|
|
- |
|
|
|
(46 |
) |
|
Cash dividends declared
|
|
|
- |
|
|
|
- |
|
|
|
- |
|
|
|
- |
|
|
|
- |
|
|
|
- |
|
|
|
(47,001 |
) |
|
|
- |
|
|
|
(47,001 |
) |
|
Other comprehensive income (loss)
|
|
|
- |
|
|
|
- |
|
|
|
- |
|
|
|
- |
|
|
|
- |
|
|
|
520 |
|
|
|
- |
|
|
|
(76 |
) |
|
|
444 |
|
|
Balance at June 30, 2019
|
|
|
49,049 |
|
|
$ |
491 |
|
|
$ |
377,913 |
|
|
|
22,462 |
|
|
$ |
(656,597 |
) |
|
$ |
(5,651 |
) |
|
$ |
647,710 |
|
|
$ |
63 |
|
|
$ |
363,929 |
|
|
See accompanying notes to consolidated financial statements.
|
ETHAN ALLEN INTERIORS INC. AND SUBSIDIARIES
NOTES TO THE CONSOLIDATED FINANCIAL STATEMENTS
|
(1)
|
Organization and Nature of Business
|
Founded in 1932 and incorporated in Delaware in 1989, Ethan Allen Interiors Inc., through its wholly-owned subsidiary, Ethan Allen Global, Inc., and Ethan Allen Global, Inc.’s subsidiaries (collectively, “we,” “us,” “our,” “Ethan Allen” or the “Company”), is a leading interior design company, manufacturer and retailer in the home furnishings marketplace. Today we are a global luxury international home fashion brand that is vertically integrated from design through delivery, which affords our clientele a value proposition of style, quality and price. We provide complimentary interior design service to our customers and sell a full range of furniture products and decorative accents through a retail network of approximately 300 design centers in the United States and abroad as well as online at ethanallen.com. The design centers represent a mix of independent licensees and Company-owned and operated locations. Nearly all our Company operated retail design centers are located in the United States , with the remaining Company operated design centers located in Canada. The majority of the independently operated design centers are in Asia, with the remaining independently operated design centers located throughout the United States, the Middle East and Europe. We also own and operate six manufacturing facilities, including three manufacturing plants and one sawmill in the United States and one manufacturing plant in Mexico and one in Honduras.
|
(2)
|
Basis of Presentation
|
Principles of Consolidation. Ethan Allen conducts business globally and has strategically aligned its business into two reportable segments: Wholesale and Retail. These two segments represent strategic business areas of our vertically integrated enterprise that operate separately and provide their own distinctive services. The accompanying consolidated financial statements include the accounts of the Company and its wholly owned subsidiaries. Our consolidated financial statements also include the accounts of an entity in which we are a majority shareholder with the power to direct the activities that most significantly impact the entity’s performance. Noncontrolling interest amounts in the entity are immaterial and included in the Consolidated Statements of Comprehensive Income within interest and other income, net. All intercompany activity and balances have been eliminated from the consolidated financial statements.
Use of Estimates. We prepare our consolidated financial statements in accordance with U.S. GAAP, which requires management to make estimates and assumptions that affect the reported amounts of assets and liabilities and disclosure of contingent assets and liabilities at the date of the consolidated financial statements and the reported amounts of net sales and expenses during the reporting period. Due to the inherent uncertainty involved in making those estimates, actual results could differ from those estimates. Areas in which significant estimates have been made include, but are not limited to, goodwill and indefinite-lived intangible asset impairment analyses, useful lives for property, plant and equipment, inventory obsolescence, business insurance retention reserves, tax valuation allowances and the evaluation of uncertain tax positions.
Reclassifications. Certain reclassifications have been made to prior years’ financial statements to conform to the current year’s presentation. These changes were made for disclosure purposes only and did not have any impact on previously reported results.
The Company has evaluated subsequent events through the date that the financial statements were issued.
|
(3)
|
Summary of Significant Accounting Policies
|
The significant accounting policies of the Company and its subsidiaries are summarized below.
Cash and Cash Equivalents
Cash and short-term, highly liquid investments with original maturities of three months or less are considered cash and cash equivalents and are reported at fair value. Our corporate money market funds are readily convertible into cash and the net asset value of each fund on the last day of the month is used to determine its fair value. We invest excess cash in money market accounts and short-term commercial paper. As of June 30, 2019 and 2018, we had no restricted cash on hand.
Accounts Receivable
Accounts receivable arise from the sale of products on trade credit terms and is presented net of allowance for doubtful accounts. We maintain an allowance for estimated losses resulting from the inability of our customers to make required payments. The allowance for doubtful accounts is based on a review of specifically identified accounts in addition to an overall aging analysis. Judgments are made with respect to the collectability of accounts receivable based on historical experience and current economic trends. On a monthly basis, we review all significant accounts as to their past due balances, as well as collectability of the outstanding trade accounts receivable for possible write-off. It is our policy to write-off the accounts receivable against the allowance account when we deem the receivable to be uncollectible. Additionally, we review orders from retailers that are significantly past due, and we ship product only when our ability to collect payment from our customer for the new order is probable. At June 30, 2019 and 2018, the allowance for doubtful accounts was immaterial, respectively.
ETHAN ALLEN INTERIORS INC. AND SUBSIDIARIES
Inventories
Inventories are stated at the lower of cost (on first-in, first-out basis) or net realizable value. Cost is determined based solely on those charges incurred in the acquisition and production of the related inventory (i.e. material, labor and manufacturing overhead costs).
Property, Plant and Equipment
Property, plant and equipment are stated at cost, less accumulated depreciation and amortization. Depreciation of property, plant and equipment is provided over the estimated useful lives of the respective assets on a straight-line basis. Estimated useful lives of the respective assets typically range from twenty to forty years for buildings and improvements and from three to twenty years for machinery and equipment. Capitalized computer software costs include internal and external costs incurred during the software's development stage and are depreciated over three to five years. Leasehold improvements are amortized over the shorter of the underlying lease term or the estimated useful life. Repairs and maintenance expenditures, which are not considered leasehold improvements and do not extend the useful life of the property and equipment, are expensed as incurred.
Retirement or dispositions of long-lived assets are recorded based on carrying value and proceeds received. Any resulting gains or losses are recorded as a component of selling, general and administrative expenses.
Property, plant and equipment is reviewed for impairment at least annually or whenever events or changes in circumstances indicate that the carrying amount of assets may not be recoverable. For further discussion regarding impairments refer to the Impairment of Long-Lived Assets accounting policy below.
Assets Held for Sale
An asset is considered to be held for sale when all of the following criteria are met: (i) management commits to a plan to sell the property; (ii) it is unlikely that the disposal plan will be significantly modified or discontinued; (iii) the property is available for immediate sale in its present condition; (iv) actions required to complete the sale of the property have been initiated; (v) sale of the asset is probable and the completed sale is expected to occur within one year; and (vi) the property is actively being marketed for sale at a price that is reasonable given its current market value.
Upon designation as an asset held for sale, the carrying value of the asset is recorded at the lower of its carrying value or its estimated fair value less estimated costs to sell, and the Company ceases depreciating the asset. As of June 30, 2019 and 2018, we did not have any assets held for sale.
Impairment of Long-Lived Assets
We review the carrying value of our long-lived assets for impairment at least annually or whenever events or changes in circumstances indicate that their carrying amounts may not be recoverable. Our assessment of recoverability is based on our best estimates using either quoted market prices or an analysis of the undiscounted projected future cash flows by asset groups in order to determine if there is any indicator of impairment requiring us to further assess the fair value of our long-lived assets. If the sum of the estimated undiscounted future cash flows related to the asset is less than the carrying value, we recognize a loss equal to the difference between the carrying value and the fair value, usually determined by the estimated discounted cash flow analysis of the assets. Our asset groups consist of our operating segments in our Wholesale reportable segment, each of our retail design centers and other corporate assets. The asset group is defined as the lowest level for which identifiable cash flows are available and largely independent of the cash flows of other groups of assets, which for our retail segment is the individual retail design center and for our wholesale segment is the manufacturing plant level. We estimate future cash flows based on design center-level historical results, current trends, and operating and cash flow projections. Our estimates are subject to uncertainty and may be affected by a number of factors outside its control, including general economic conditions and the competitive environment. While we believe our estimates and judgments about future cash flows are reasonable, future impairment charges may be required if the expected cash flow estimates, as projected, do not occur or if events change requiring us to revise its estimates. During fiscal 2019, our retail segment recorded a $9.9 million impairment for long-lived assets at the retail design center level. There were no impairments during fiscal 2018 or 2017. Refer to Note 10, Restructuring and Impairment Activities, for further disclosure on the long-lived asset impairment.
ETHAN ALLEN INTERIORS INC. AND SUBSIDIARIES
Goodwill and Other Indefinite-Lived Intangible Assets
Our goodwill and intangible assets are comprised primarily of goodwill, which represents the excess of cost over the fair value of net assets acquired, and our Ethan Allen trade name and related trademarks. We determined these assets have indefinite useful lives, and are therefore not amortized.
We are required to test goodwill and indefinite-lived intangibles at the reporting level for potential impairment annually, or more frequently if impairment indicators occur. Goodwill and other indefinite-lived intangible assets are evaluated for impairment on an annual basis during the fourth quarter of each fiscal year, and between annual tests whenever events or circumstances indicate that the carrying value of the goodwill or other intangible asset may exceed its fair value.
Goodwill. When testing goodwill for impairment, we may assess qualitative factors for some or all of our reporting units to determine whether it is more likely than not (that is, a likelihood of more than 50 percent) that the fair value of a reporting unit is less than its carrying amount, including goodwill. Alternatively, we may bypass this qualitative assessment for some or all of our reporting units and determine whether the carrying value exceeds the fair value using a quantitative assessment, as described below. We have two reporting units; wholesale and retail, which are consistent with our reportable operating segments. Only our wholesale reporting unit has goodwill remaining at June 30, 2019. We performed our annual qualitative goodwill impairment test during the fourth quarter of fiscal 2019, consistent with the timing of previous years, and concluded that there was no impairment.
Other Indefinite-Lived Intangible Assets (trade name). The fair value of our trade name, which is the Company’s only indefinite-lived intangible asset other than goodwill, is qualitatively assessed annually in the fourth quarter and may be reviewed more frequently if indicators of impairment are present. Conditions that may indicate impairment include, but are not limited to, a significant adverse change in customer demand or business climate that could affect the value of an asset, a product recall or an adverse action or assessment by a regulator. We performed our annual trade name impairment test during the fourth quarter of fiscal 2019, consistent with the timing of previous years, and concluded that there was no impairment.
Fair Value of Financial Instruments
Because of their short-term nature, the carrying value of our cash and cash equivalents, receivables and payables, short-term debt and customer deposit liabilities approximates fair value. At June 30, 2019 and 2018, our total debt consisted of capital leases obligations. The estimated fair value is equal to the carrying value on those dates.
Income Taxes
Income taxes are accounted for under the asset and liability method. Deferred tax assets and liabilities are recognized for the future tax consequences attributable to differences between the financial statement carrying amounts of existing assets and liabilities and their respective tax bases and operating loss and tax credit carryforwards.
Deferred tax assets and liabilities are measured using enacted tax rates expected to apply to taxable income in the years in which those temporary differences are expected to be recovered or settled. The effect on deferred tax assets and liabilities of a change in tax rates is recognized in income in the period that includes the enactment date. A valuation allowance must be established for deferred tax assets when it is more likely than not that the assets will not be realized.
We recognize the tax benefit from an uncertain tax position only if it is more likely than not that the tax position will be sustained on examination by the taxing authorities, based on the technical merits of the position. Most of the unrecognized tax benefits, if recognized, would be recorded as a benefit to income tax expense. The liability associated with an unrecognized tax benefit is classified as a long-term liability except for the amount for which a cash payment is expected to be made or tax positions settled within one year. We recognize interest and penalties related to income tax matters as a component of income tax expense.
Revenue Recognition
Our reported revenue (net sales) consist substantially of product sales. We report product sales net of discounts and recognize them at the point in time when control transfers to the customer. For sales to our customers in our wholesale segment, control typically transfers when the product is shipped. For sales in our retail segment, control generally transfers upon delivery to the customer.
Estimated refunds for returns and allowances are recorded using our historical return patterns. We record estimated refunds for sales returns on a gross basis rather than on a net basis and have recorded an asset for product we expect to receive back from customers in Prepaid expenses and other current assets and a corresponding refund liability in Other Current Liabilities on our consolidated balance sheet. At June 30, 2019 and 2018, these amounts were immaterial.
ETHAN ALLEN INTERIORS INC. AND SUBSIDIARIES
Refer to Note 4, Revenue Recognition, for additional information regarding revenue.
Cost of Sales
Our cost of sales consist primarily of the cost to manufacture or purchase our merchandise (i.e. direct material, labor and overhead costs) as well as inspection, internal transfer, in-bound freight and warehousing costs.
Selling, General and Administrative Expenses (“SG&A”)
SG&A expenses include the costs of selling our products and other general and administrative costs. Selling expenses are primarily composed of shipping and handling costs, commissions, advertising, warranty, and compensation and benefits of employees performing various sales functions. Occupancy costs, depreciation, compensation and benefit costs for administration employees and other administrative costs are included in SG&A.
Shipping and Handling Costs
Our practice has been to sell our products at the same delivered cost to all retailers and customers nationwide, regardless of shipping point. Costs incurred by the Company to deliver finished goods are expensed and recorded in selling, general and administrative expenses. Shipping and handling costs amounted to $75.6 million in fiscal year 2019, $73.6 million for fiscal 2018 and $71.3 million in fiscal 2017.
Advertising Costs
Advertising costs are expensed when first aired or distributed. Our total advertising costs were $30.5 million in fiscal year 2019, $43.3 million in fiscal year 2018 and $39.7 million in fiscal year 2017. These amounts include advertising media expenses, outside and inside agency expenses, certain website related fees and photo and video production. Prepaid advertising costs were immaterial at June 30, 2019 and 2018, respectively.
Deferred Financing Fees
Deferred financing fees related to our revolving credit facility are included in non-current assets on the consolidated balance sheets and amortized utilizing the effective interest method. Such amortization is included in interest expense, net on the consolidated statements of comprehensive income.
Operating Leases
The Company leases retail design centers, distribution facilities, office space and, less significantly, certain equipment. We classify leases at the inception of the lease as a capital or an operating lease. In a capital or an operating lease, the expected lease term begins with the date that we take possession of the equipment or the leased space for construction and other purposes. The expected lease term may also include the exercise of renewal options if the exercise of the option is determined to be reasonably assured. The expected term is also used in the determination of whether a design center is a capital or operating lease. We record expense for operating leases on a straight-line basis, beginning on the date that we take possession or control of the property. Several of our operating lease agreements contain provisions for tenant improvement allowances, rent holidays, rent concessions, and/or rent escalations.
Incentive payments received from landlords are recorded as deferred lease incentives and are amortized over the underlying lease term on a straight-line basis as a reduction of rent expense. When the terms of an operating lease provide for periods of free rent, rent concessions, and/or rent escalations, we establish a deferred rent liability for the difference between the scheduled rent payment and the straight-line rent expense recognized. This deferred rent liability is also amortized over the underlying lease term on a straight-line basis as a reduction of rent expense.
Acquisitions
From time to time we acquire design centers from our independent retailers in arms-length transactions. We record these acquisitions using the acquisition method of accounting. All of the assets acquired, liabilities assumed, contractual contingencies and contingent consideration are recognized at their fair value on the acquisition date. Cash paid to acquire design centers during fiscal 2019, 2018 and 2017 was $0.5 million, $6.3 million and $0.7 million, respectively. Acquisition-related expenses are recognized separately and expensed as incurred.
ETHAN ALLEN INTERIORS INC. AND SUBSIDIARIES
Share-Based Compensation
Share-based compensation expense is included within selling, general and administrative expenses. Tax benefits associated with our share-based compensation arrangements are included within income tax expense.
We estimate, as of the date of grant, the fair value of stock options awarded using the Black-Scholes option pricing model. Use of a valuation model requires management to make certain assumptions with respect to selected model inputs, including anticipated changes in the underlying stock price (i.e. expected volatility) and option exercise activity (i.e. expected life). Expected volatility is based on the historical volatility of our stock and other contributing factors. The expected life of options granted, which represents the period of time that the options are expected to be outstanding, is based, primarily, on historical data.
We estimate, as of the date of grant, the fair value of restricted stock units awarded using a discounted cash flow model, which requires management to make certain assumptions with respect to model inputs including anticipated future dividends not paid during the restriction period, and a discount for lack of marketability for a one-year holding period after vesting.
As share-based compensation expense recognized is based on awards ultimately expected to vest, it has been reduced for estimated forfeitures. Forfeitures are estimated at the time of grant and revised, if necessary, in subsequent periods if actual forfeitures differ from those estimates. Forfeitures are estimated based primarily on historical experience. Windfall tax benefits, defined as tax deductions that exceed recorded share-based compensation, are classified as cash inflows from financing activities.
Performance-based stock units require management to make assumptions regarding the likelihood of achieving Company performance targets on a quarterly basis. The number of performance-based options that vest will be predicated on the Company achieving certain performance levels. A change in the financial performance levels the Company achieves could result in changes to our current estimate of the vesting percentage and related share-based compensation.
Earnings Per Share
We compute basic earnings per share (“EPS”) by dividing net income by the weighted average number of common shares outstanding during the period. Diluted EPS is calculated similarly, except that the weighted average outstanding shares are adjusted to include the effects of converting all potentially dilutive share-based awards issued under our employee stock plans. The number of potential common shares outstanding are determined in accordance with the treasury stock method to the extent they are dilutive. For the purpose of calculating EPS, common shares outstanding include common shares issuable upon the exercise of outstanding share-based compensation awards, including employee stock options and restricted stock. Under the treasury stock method, the exercise price paid by the optionee and future share-based compensation expense that the Company has not yet recognized are assumed to be used to repurchase shares.
Foreign Currency Translation
The functional currency of each Company operated foreign location is the respective local currency. Assets and liabilities are translated into U.S. dollars using the current period-end exchange rate and income and expense amounts are translated using the average exchange rate for the period in which the transaction occurred. Resulting translation adjustments are reported as a component of accumulated other comprehensive income (loss) within shareholders’ equity.
Treasury Stock
The Company accounts for repurchased common stock under the cost method and includes such treasury stock as a component of its shareholders’ equity. We account for the formal retirement of treasury stock by deducting its par value from common stock, reducing additional paid-in capital (“APIC”) by the average amount recorded in APIC when the stock was originally issued and any remaining excess of cost deducted from retained earnings.
Recent Accounting Pronouncements
As of the beginning of fiscal 2019, we implemented all applicable new accounting standards and updates issued by the Financial Accounting Standards Board (“FASB”) that were in effect. There were no new standards or updates adopted during fiscal 2019 that had a material impact on our consolidated financial statements.
New Accounting Standards or Updates Adopted in fiscal 2019
Revenue Recognition. In May 2014, the FASB issued Accounting Standards Update (“ASU”) 2014-09, Revenue from Contracts with Customers (Accounting Standards Codification Topic 606 (“ASC 606”)), which requires an entity to recognize the amount of revenue to which it expects to be entitled for the transfer of promised goods or services to customers. The new standard supersedes virtually all existing authoritative accounting guidance on revenue recognition and requires additional disclosures and greater use of estimates and judgments. We adopted the new standard in the first quarter of fiscal 2019. We reviewed substantially all of our contracts and revenue streams and determined that while the application of the new standard did not have a material change in the amount of or timing for recognizing revenue, it did impact our financial statement disclosures related to net sales and related accounts. See Note 4 for further details on these new disclosures.
ETHAN ALLEN INTERIORS INC. AND SUBSIDIARIES
Cash Flow Simplification. In August 2016, the FASB issued ASU 2016-15, Statement of Cash Flow (Topic 230): Classification of Certain Cash Receipts and Cash Payments. The new guidance is intended to reduce the diversity in practice around how certain transactions are classified in the statement of cash flows. This includes revised guidance on the cash flow classification of debt prepayments and debt extinguishment costs, contingent consideration payments made after a business combination and distributions received from equity method investments. We adopted the provisions of this guidance in the first quarter of fiscal 2019 with retrospective application. The adoption of this guidance did not have a material impact on our consolidated financial statements.
Restricted Cash. In November 2016, the FASB issued ASU 2016-18, Statement of Cash Flows (Topic 230): Restricted Cash, which is intended to reduce diversity in the presentation of restricted cash and restricted cash equivalents in the cash flow statement. The statement requires that restricted cash and restricted cash equivalents be included as components of total cash and cash equivalents as presented on the statement of cash flows. The Company had not previously included restricted cash as a component of cash and cash equivalents as presented on its consolidated statement of cash flows. We adopted the new standard in the first quarter of fiscal 2019, under the retrospective adoption method, and prior year restricted cash has been reclassified to conform to current year presentation. See Note 5 for further details.
Share-Based Payments. In May 2017, the FASB issued ASU 2017-09, Compensation – Stock Compensation (Topic 718): Scope of Modification Accounting, which amended the scope of modification accounting for share-based payment arrangements. The guidance focused on changes to the terms or conditions of share-based payment awards that would require the application of modification accounting and specifies that an entity would not apply modification accounting if the fair value, vesting conditions and classification of the awards are the same immediately before and after the modification. We adopted ASU 2017-09 in the first quarter of fiscal 2019. The adoption of this standard had no impact on our consolidated financial statements.
Recent Accounting Standards or Updates Not Yet Effective
Leases. In February 2016, the FASB issued ASU 2016-02, Leases (Topic 842), an update related to accounting for leases. The standard introduces a lessee model that will require lessees to recognize on the balance sheet the assets and liabilities for the rights and obligations created by those leases with terms of more than twelve months. Lessors will remain largely unchanged from current GAAP. In addition, ASU 2016-02 will require disclosures to help investors and other financial statement users better understand the amount, timing and uncertainty of cash flows arising from leases. We are required to adopt ASU 2016-02 in the first quarter of fiscal 2020 and expect to apply the modified retrospective approach, which allows for a cumulative-effect adjustment at the beginning of the period of adoption and does not require application of the guidance to comparative periods. We plan to elect certain practical expedients permitted under the transition guidance, including the package of practical expedients, which allows the Company to not reassess whether existing contracts contain leases, the lease classification of existing leases, or initial direct costs for existing leases. We also plan to elect not to separate lease and non-lease components and not to recognize a right-of-use asset and a lease liability for leases with an initial term of twelve months or less. In addition, we plan to not elect the hindsight practical expedient. A complete population of contracts that meet the definition of a lease under ASU 2016-02 has been identified. We have reviewed this inventory of leases and are in the final stage of implementing a third-party lease accounting software system and finalizing our control framework in preparation for the adoption of this standard in the first quarter of fiscal 2020. We currently expect the adoption to have a material impact to our consolidated balance sheet in order to recognize the right of use assets and related liabilities, including enhanced disclosures. However, we do not expect the adoption to have a material impact on our consolidated statements of comprehensive income or cash flows.
Goodwill Impairment Test. In January 2017, the FASB issued ASU 2017-04, Intangibles-Goodwill and Other (Topic 350): Simplifying the Test for Goodwill Impairment, which removes the requirement for companies to compare the implied fair value of goodwill with its carrying amount as part of step 2 of the goodwill impairment test. A goodwill impairment will now be the amount by which a reporting unit’s carrying value exceeds its fair value, not to exceed the carrying amount of goodwill. This accounting standards update will be effective for us beginning in the first quarter of fiscal 2021 and we do not expect the adoption to have a material impact on our consolidated financial statements.
ETHAN ALLEN INTERIORS INC. AND SUBSIDIARIES
Implementation Costs in a Cloud Computing Arrangement - In August 2018, the FASB issued ASU 2018-15, Intangibles-Goodwill and Other-Internal-Use Software (Subtopic 350-40): Customer’s Accounting for Implementation Costs Incurred in a Cloud Computing Arrangement That Is a Service Contract, an update related to accounting for implementation costs incurred in a cloud computing arrangement that is a service contract. This guidance aligns the requirements for capitalizing implementation costs in a cloud computing service contract with the guidance for capitalizing implementation costs to develop or obtain internal-use software. Capitalized implementation costs related to a hosting arrangement that is a service contract will be amortized over the term of the hosting arrangement, beginning when the module or component of the hosting arrangement is ready for its intended use. This accounting standards update will be effective for us beginning in the first quarter of fiscal 2021, with early adoption permitted. We are currently evaluating the impact of this accounting standards update, but do not expect the adoption to have a material impact on our consolidated financial statements.
No other new accounting pronouncements issued or effective as of June 30, 2019 have had or are expected to have an impact on our consolidated financial statements.
We adopted ASC 606 using the cumulative effect approach, which required us to apply the new guidance retrospectively to revenue transactions completed on or after July 1, 2018.
Upon adoption of ASC 606, we have elected the following accounting policies and practical expedients:
| |
●
|
We recognize shipping and handling expense as fulfillment activities (rather than as a promised good or service) when the activities are performed even if those activities are performed after the control of the good has been transferred. Accordingly, we record the expenses for shipping and handling activities at the same time we recognize net sales.
|
| |
●
|
We exclude from the measurement of the transaction price all taxes imposed on and concurrent with a specific revenue-producing transaction and collected by the entity from a customer, including sales, use, excise, value-added, and franchise taxes (collectively referred to as sales taxes).
|
| |
●
|
We do not adjust net sales for the effects of financing components if the contract has a duration of one year or less, as we believe that we will receive payment from the customer within one year of when we transfer control of the related goods.
|
Our reported revenue (net sales) consist substantially of product sales. We report product sales net of discounts and recognize them at the point in time when control transfers to the customer. For sales to our customers in our wholesale segment, control typically transfers when the product is shipped. For sales in our retail segment, control generally transfers upon delivery to the customer.
Estimated refunds for returns and allowances are recorded using our historical return patterns. Under ASC 606, we record estimated refunds for sales returns on a gross basis rather than on a net basis and have recorded an asset for product we expect to receive back from customers in Prepaid expenses and other current assets and a corresponding refund liability in Accounts payable and accrued expenses on our consolidated balance sheets. At June 30, 2019 and 2018, these amounts were immaterial.
In many cases we receive deposits from customers before we have transferred control of our product to our customers, resulting in contract liabilities. These contract liabilities are reported as a current liability in Customer Deposits on our consolidated balance sheets. At June 30, 2018 we had customer deposits of $61.2 million, which were subsequently recognized as net sales upon delivery to the customer during fiscal 2019. Customer deposits totaled $56.7 million at June 30, 2019.
ETHAN ALLEN INTERIORS INC. AND SUBSIDIARIES
The following table disaggregates our net sales by product category by segment for the fiscal year ended June 30, 2019:
|
(Amounts in thousands)
|
|
Wholesale
|
|
|
Retail
|
|
|
Total
|
|
|
Upholstery furniture
|
|
$ |
216,460 |
|
|
$ |
263,744 |
|
|
$ |
480,204 |
|
|
Case goods furniture
|
|
|
151,999 |
|
|
|
172,293 |
|
|
|
324,292 |
|
|
Home accents
|
|
|
77,978 |
|
|
|
130,325 |
|
|
|
208,303 |
|
|
Other
|
|
|
(4,886 |
) |
|
|
23,467 |
|
|
|
18,581 |
|
|
Total before intercompany eliminations
|
|
$ |
441,551 |
|
|
$ |
589,829 |
|
|
|
1,031,380 |
|
|
Eliminations
|
|
|
|
|
|
|
|
|
|
|
(284,696 |
) |
|
Consolidated Net Sales
|
|
|
|
|
|
|
|
|
|
$ |
746,684 |
|
| |
●
|
Upholstery furniture includes fabric-covered items such as sleepers, recliners and other motion furniture, chairs, ottomans, custom pillows, sofas, loveseats, cut fabrics and leather.
|
| |
●
|
Case goods furniture includes items such as beds, dressers, armoires, tables, chairs, buffets, entertainment units, home office furniture, and wooden accents.
|
| |
●
|
Home accents includes items such as window treatments and drapery hardware, wall décor, florals, lighting, clocks, mattresses, bedspreads, throws, pillows, decorative accents, area rugs, wall coverings and home and garden furnishings.
|
| |
●
|
Other includes net sales for product delivery, the Ethan Allen Hotel room rentals and banquets, our net share of third-party furniture protection plans, non-inventoried parts, and consulting and other fees, net of discounts, allowances and other sales incentives.
|
We did not hold any restricted cash at June 30, 2019 or 2018. At June 30, 2017 we held $7.3 million of restricted cash in lieu of providing letters of credit for the benefit of the provider of our workmen’s compensation and other insurance liabilities. By June 30, 2018, this obligation had been reduced to $5.9 million, which was then exchanged for a letter of credit for the benefit of this provider, and the restricted cash balance was reduced to zero. As such, we did not hold any restricted cash at June 30, 2019 or 2018.
|
(6)
|
Fair Value Measurement
|
Fair value is defined as the price that would be received from selling an asset or paid to transfer a liability (i.e., the “exit price”) in an orderly transaction between market participants at the measurement date. In determining fair value, the use of various valuation methodologies, including market, income and cost approaches is permissible. We consider the principal or most advantageous market in which it would transact and considers assumptions that market participants would use when pricing the asset or liability.
Fair Value Hierarchy. The accounting guidance for fair value measurements establishes a fair value hierarchy that requires an entity to maximize the use of observable inputs and minimize the use of unobservable inputs when measuring fair value. There are three levels of inputs that may be used to measure fair value based on the reliability of inputs. A financial instrument’s categorization within the fair value hierarchy is based upon the lowest level of input that is significant to the fair value measurement. Our assessment of the significance of a particular input to the fair value measurement requires judgment and may affect their placement within the fair value hierarchy levels. We have categorized our cash equivalents as Level 1 assets within the fair value hierarchy as there are quoted prices in active markets for identical assets or liabilities. There were no Level 2 or Level 3 assets or liabilities held by the Company as of June 30, 2019 and 2018.
Assets and Liabilities Measured at Fair Value on a Non-Recurring Basis. We measure certain assets at fair value on a non-recurring basis. These assets are recognized at fair value when they are deemed to be other-than-temporarily impaired. With the exception of the $9.9 million retail design center asset impairment charge, we did not record any additional other-than-temporary impairments on those assets required to be measured at fair value on a non-recurring basis during fiscal 2019. In addition, we did not hold any available-for-sale securities during fiscal 2019 and 2018, thus no fair value measurements were required. Refer to Note 10, Restructuring and Impairment Activities, for further disclosure of the retail design center asset impairment charge.
ETHAN ALLEN INTERIORS INC. AND SUBSIDIARIES
Inventories at June 30, 2019 and 2018 are summarized as follows (in thousands):
| |
|
2019
|
|
|
2018
|
|
| |
|
|
|
|
|
|
|
|
|
Finished goods
|
|
$ |
128,047 |
|
|
$ |
124,640 |
|
|
Work in process
|
|
|
9,185 |
|
|
|
12,057 |
|
|
Raw materials
|
|
|
26,661 |
|
|
|
27,947 |
|
|
Inventory reserve
|
|
|
(1,504 |
) |
|
|
(1,632 |
) |
|
Inventories, net
|
|
$ |
162,389 |
|
|
$ |
163,012 |
|
|
(8)
|
Property, Plant and Equipment
|
Property, plant and equipment at June 30, 2019 and 2018 are summarized as follows (in thousands):
| |
|
2019
|
|
|
2018
|
|
| |
|
|
|
|
|
|
|
|
|
Land and improvements
|
|
$ |
83,343 |
|
|
$ |
82,899 |
|
|
Building and improvements
|
|
|
384,641 |
|
|
|
404,522 |
|
|
Machinery and equipment
|
|
|
123,396 |
|
|
|
123,606 |
|
|
Property, plant and equipment, gross
|
|
|
591,380 |
|
|
|
611,027 |
|
|
Less: accumulated depreciation and amortization
|
|
|
(346,134 |
) |
|
|
(343,124 |
) |
|
Property, plant and equipment, net
|
|
$ |
245,246 |
|
|
$ |
267,903 |
|
We recorded depreciation expense of $19.6 million, $19.8 million and $20.1 million in fiscal 2019, fiscal 2018 and fiscal 2017, respectively.
|
(9)
|
Goodwill and Other Intangible Assets
|
At both June 30, 2019 and 2018, we had $25.4 million of goodwill and $19.7 million of other indefinite-lived intangible assets consisting of Ethan Allen trade names, all of which is in our wholesale segment.
Both goodwill and indefinite-lived intangible assets are not amortized as they are estimated to have an indefinite life. We used a qualitative approach for our wholesale segment goodwill impairment test in fiscal 2019 due to the relative fair value of our reporting unit significantly exceeding the carrying value of the goodwill, as well as the operating performance of that respective reporting unit. Based on this qualitative assessment, we concluded that it is more likely than not that the fair value of our wholesale goodwill exceeded its carrying value.
We also used a qualitative approach for our trade names impairment test in fiscal 2019 and concluded that it is more likely than not that the fair value of our trade name exceeded its carrying value.
|
(10)
|
Restructuring and Impairment Activities
|
Optimization of Manufacturing and Logistics
During fiscal 2019, we began to execute plans to consolidate our manufacturing and logistics operations as part of an overall strategy to maximize production efficiencies and maintain our competitive advantage. In April 2019, the following changes to our operations were announced as we continue to improve the vertical integration of our business operations.
| |
●
|
Our 550,000 square foot Old Fort, North Carolina case goods manufacturing plant, while maintaining a lumber processing facility, will be converted into a state-of-the-art distribution center to support our national distribution structure and growing GSA contract business.
|
| |
●
|
Consolidating approximately half of the case goods manufacturing from our Old Fort plant into our case goods plants in Orleans and Beecher Falls, Vermont, with the balance to be consolidated into our other manufacturing facilities.
|
| |
●
|
Expansion of our Maiden, North Carolina campus with the addition of 80,000 square feet of operating space.
|
| |
●
|
Distribution operations and art framing production at our Passaic, New Jersey facility will be discontinued with the distribution operations moved to our operations in North Carolina and the art framing operations outsourced.
|
ETHAN ALLEN INTERIORS INC. AND SUBSIDIARIES
As of June 30, 2019, we have permanently ceased operations at our Passaic, New Jersey facility and, for the most part, transferred our Old Fort case goods manufacturing operations to other existing operations. As a result, approximately 325 of our associates in Old Fort and 55 associates in Passaic were terminated. We plan to continue with the optimization project during fiscal 2020 as we convert Old Fort into a distribution center and expand our existing Maiden, North Carolina campus.
For these fourth quarter of fiscal 2019 actions, we recorded pre-tax restructuring, impairment, and other related charges totaling $8.3 million, consisting of $3.1 million in impairments of long-lived assets, $2.8 million in employee severance and other payroll and benefit costs, $2.0 million in inventory write-downs and manufacturing variances and $0.4 million of other associated costs, including freight and relocation expenses. The inventory write-downs and abnormal manufacturing overhead variances of $2.0 million were recorded within Cost of Sales with the remaining $6.3 million recorded within the line item Restructuring and Impairment Charges in the consolidated statement of comprehensive income.
Retail Design Center Long-Lived Assets Impairment
During the fourth quarter of fiscal 2019, we recorded a non-cash impairment charge of $9.9 million related to the impairment of long-lived assets held at certain retail design center locations. Due to retail segment operating losses and a recent organizational realignment, we identified this as a fiscal 2019 triggering event requiring assessment of recoverability. The asset group used in the impairment analysis, which represented the lowest level for which identifiable cash flows were available and largely independent of the cash flows of other groups of assets, was the individual retail design center. We estimated future cash flows based on design center-level historical results, current trends, and operating and cash flow projections. The impairment charge of $9.9 million was recorded in the consolidated statement of comprehensive income within the line item Restructuring and Impairment Charges.
Lease Exit Costs and Other Charges
During the fourth quarter of fiscal 2019 we recorded $2.1 million of charges primarily related to remaining contractual obligations under leased retail design center space for which we ceased using as of June 30, 2019. The amount of the charge was equal to all costs that will continue to be incurred under our lease for its remaining term without economic benefit and measured at fair value when we ceased using the right conveyed by the contract. The pre-tax charge was recorded in the consolidated statement of comprehensive income within the line item Restructuring and Impairment Charges.
Summary of Restructuring, Impairments and Other related charges
Restructuring, impairment and other related fiscal 2019 charges are summarized in the table below (in thousands):
| |
|
Fiscal 2019
|
|
| |
|
Charges
|
|
|
Optimization of manufacturing and logistics
|
|
$ |
6,330 |
|
|
Impairment of long-lived assets at retail design centers
|
|
|
9,913 |
|
|
Lease exit costs (remaining lease rentals)
|
|
|
2,662 |
|
|
Other charges (income)
|
|
|
(525 |
) |
|
Total Restructuring, Impairments and other charges
|
|
$ |
18,380 |
|
| |
|
|
|
|
|
Inventory write-downs and manufacturing overhead costs
|
|
|
1,994 |
(1) |
|
Total
|
|
$ |
20,374 |
|
|
(1)
|
Inventory write-downs and manufacturing overhead costs are reported within Cost of Sales in the consolidated statements of comprehensive income.
|
ETHAN ALLEN INTERIORS INC. AND SUBSIDIARIES
Restructuring, Impairments and Other Related Charges Rollforward
Activity in the Company’s restructuring reserves is summarized in the table below (in thousands):
| |
|
Balance
|
|
|
Fiscal 2019 Activity
|
|
|
Balance
|
|
|
Optimization of Manufacturing and Logistics
|
|
June 30, 2018
|
|
|
New Charges
|
|
|
Non-Cash
|
|
|
Payments
|
|
|
June 30, 2019
|
|
|
Employee severance, other payroll and benefit costs
|
|
$ |
- |
|
|
$ |
2,837 |
|
|
$ |
- |
|
|
$ |
(1,123 |
) |
|
$ |
1,714 |
(1) |
|
Accelerated depreciation of long-lived assets
|
|
|
- |
|
|
|
3,112 |
|
|
|
3,112 |
|
|
|
- |
|
|
|
- |
|
|
Inventory write-downs and manufacturing overhead costs
|
|
|
- |
|
|
|
1,994 |
|
|
|
1,128 |
|
|
|
(866 |
) |
|
|
- |
|
|
Other exit and relocation costs
|
|
|
- |
|
|
|
381 |
|
|
|
283 |
|
|
|
(98 |
) |
|
|
- |
|
|
Sub-total
|
|
|
- |
|
|
|
8,324 |
|
|
|
4,523 |
|
|
|
(2,087 |
) |
|
|
1,714 |
|
| |
|
|
|
|
|
|
|
|
|
|
|
|
|
|
|
|
|
|
|
|
|
Retail Design Center Impairment
|
|
|
|
|
|
|
|
|
|
|
|
|
|
|
|
|
|
|
|
|
|
Impairment of long-lived assets
|
|
|
- |
|
|
|
9,913 |
|
|
|
9,913 |
|
|
|
- |
|
|
|
- |
|
| |
|
|
|
|
|
|
|
|
|
|
|
|
|
|
|
|
|
|
|
|
|
Other Restructuring and Impairment Charges
|
|
|
|
|
|
|
|
|
|
|
|
|
|
|
|
|
|
|
|
|
|
Lease exit costs (remaining lease rentals)
|
|
|
- |
|
|
|
2,662 |
|
|
|
(483 |
) |
|
|
- |
|
|
|
3,145 |
(2) |
|
Other charges (income)
|
|
|
958 |
|
|
|
(525 |
) |
|
|
- |
|
|
|
(209 |
) |
|
|
224 |
(3) |
|
Sub-total
|
|
|
958 |
|
|
|
2,137 |
|
|
|
(483 |
) |
|
|
(209 |
) |
|
|
3,369 |
|
| |
|
|
|
|
|
|
|
|
|
|
|
|
|
|
|
|
|
|
|
|
|
Total Restructuring, Impairments and other exit costs
|
|
$ |
958 |
|
|
$ |
20,374 |
|
|
$ |
13,953 |
|
|
$ |
(2,296 |
) |
|
$ |
5,083 |
|
|
(1)
|
Remaining severance expected to be paid during the first quarter of fiscal 2020. The balance of $1.7 million is reported within Accrued compensation and benefits in our consolidated balance sheet as of June 30, 2019.
|
|
(2)
|
The current portion of the remaining lease rentals as of June 30, 2019 is recorded within Accounts payable and accrued expenses and totaled $1.1 million while the non-current portion of $2.1 million is reflected in Other long-term liabilities.
|
|
(3)
|
The remaining balance from the other charges (income) as of June 30, 2019 is recorded within Accounts payable and accrued expenses.
|
Total debt obligations at June 30, 2019 and 2018 consist of the following (in thousands):
| |
|
2019
|
|
|
2018
|
|
|
Borrowings under revolving credit facility
|
|
$ |
- |
|
|
$ |
- |
|
|
Capital leases
|
|
|
1,066 |
|
|
|
1,680 |
|
|
Total debt
|
|
|
1,066 |
|
|
|
1,680 |
|
|
Less current maturities
|
|
|
550 |
|
|
|
584 |
|
|
Total long-term debt
|
|
$ |
516 |
|
|
$ |
1,096 |
|
Capital Leases
Certain of our property and equipment are held under capital leases and have maturities ranging from fiscal 2020 to fiscal 2023. Interest rates on our capital leases range from 3.8% to 5.1%.
Revolving Credit Facility
On December 21, 2018, the Company and most of its domestic subsidiaries (the “Loan Parties”) entered into a Second Amended and Restated Credit Agreement (the “Facility”). The Facility amends and restates the existing Amended and Restated Credit Agreement, dated as of October 21, 2014, as amended. The Facility provides a revolving credit line of up to $165 million, subject to borrowing base availability, and extends the maturity of the Facility to December 21, 2023. We incurred financing costs of $0.6 million under the Facility, which are being amortized over the remaining life of the Facility using the effective interest method.
At the Company’s option, revolving loans under the Facility bear interest, based on the average availability, at an annual rate of either (a) the London Interbank Offered rate (“LIBOR”) plus 1.5% to 2.0%, or (b) the higher of (i) the prime rate, (ii) the federal funds effective rate plus 0.5%, or (iii) LIBOR plus 1.0% plus in each case 0.5% to 1.0%.
The availability of credit at any given time under the Facility will be constrained by the terms and conditions of the Facility, including the amount of collateral available, a borrowing base formula based upon numerous factors including the value of eligible inventory and eligible accounts receivable, and other restrictions contained in the Facility. All obligations under the Facility are secured by assets of the Loan Parties including inventory, receivables and certain types of intellectual property.
ETHAN ALLEN INTERIORS INC. AND SUBSIDIARIES
Borrowings under the Facility
To fund a portion of the special cash dividend paid to shareholders in January 2019, we borrowed $16.0 million from the Facility having a maturity date of December 21, 2023. By June 30, 2019, we had repaid all of the borrowed amount using cash generated from operating activities. As of June 30, 2019 and 2018, we had no borrowings outstanding under the Facility.
During fiscal years 2019, 2018 and 2017, we recorded interest expense of $0.2 million, $0.1 million and $0.8 million, respectively, on our outstanding debt amounts.
Debt Obligations
During fiscal 2019, 2018 and 2017, the weighted-average interest rates applicable under our outstanding debt obligations were 4.2%, 3.3% and 2.4%, respectively.
The following table summarizes, as of June 30, 2019, the timing of cash payments related to our outstanding long-term debt (capital lease) obligations for each of the five fiscal years subsequent to June 30, 2019, and thereafter (in thousands).
|
Fiscal Years Ended June 30,
|
|
|
|
|
|
2020
|
|
$ |
550 |
|
|
2021
|
|
|
437 |
|
|
2022
|
|
|
60 |
|
|
2023
|
|
|
19 |
|
|
2024
|
|
|
- |
|
|
2025 and thereafter
|
|
|
- |
|
|
Total scheduled debt payments
|
|
$ |
1,066 |
|
Covenants and Other Ratios
The Facility contains various restrictive and affirmative covenants, including required financial reporting, limitations on the ability to grant liens, make loans or other investments, incur additional debt, issue additional equity, merge or consolidate with or into another person, sell assets, pay dividends or make other distributions or enter into transactions with affiliates, along with other restrictions and limitations similar to those frequently found in credit agreements of this type and size. Loans under the Facility may become immediately due and payable upon certain events of default (including failure to comply with covenants, change of control or cross-defaults) as set forth in the Facility.
The Facility does not contain any significant financial ratio covenants or coverage ratio covenants other than a fixed charge coverage ratio covenant based on the ratio of (a) EBITDA, plus cash Rentals, minus Unfinanced Capital Expenditures to (b) Fixed Charges, as such terms are defined in the Facility (the “FCCR Covenant”). The FCCR Covenant only applies in certain limited circumstances, including when the unused availability under the Facility drops below $18.5 million. The FCCR Covenant ratio is set at 1.0 and measured on a trailing twelve-month basis.
At both June 30, 2019 and 2018, there was $6.1 million and $6.2 million, respectively, of standby letters of credit outstanding under the Facility. Total availability under the Facility was $158.9 million at June 30, 2019 and $108.8 million at June 30, 2018. At both June 30, 2019 and June 30, 2018, we were in compliance with all the covenants under the Facility.
|
(12)
|
Other Long-term Liabilities
|
The following table summarizes the nature of the amounts within other long-term liabilities at June 30, 2019 and 2018 (in thousands):
| |
|
2019
|
|
|
2018
|
|
| |
|
|
|
|
|
|
|
|
|
Deferred rent
|
|
$ |
17,130 |
|
|
$ |
18,020 |
|
|
Unrecognized tax benefits (non-current)
|
|
|
1,616 |
|
|
|
1,840 |
|
|
Accrued lease exit costs
|
|
|
2,089 |
|
|
|
- |
|
|
Other long-term liabilities
|
|
|
1,176 |
|
|
|
187 |
|
|
Other long-term liabilities
|
|
$ |
22,011 |
|
|
$ |
20,047 |
|
ETHAN ALLEN INTERIORS INC. AND SUBSIDIARIES
Income tax expense attributable to income before income taxes consists of the following for the fiscal years ended June 30 (in thousands):
| |
|
2019
|
|
|
2018
|
|
|
2017
|
|
|
Current:
|
|
|
|
|
|
|
|
|
|
|
|
|
|
Federal
|
|
$ |
10,133 |
|
|
$ |
10,289 |
|
|
$ |
15,265 |
|
|
State
|
|
|
1,237 |
|
|
|
1,689 |
|
|
|
1,585 |
|
|
Foreign
|
|
|
304 |
|
|
|
824 |
|
|
|
445 |
|
|
Total current
|
|
|
11,674 |
|
|
|
12,802 |
|
|
|
17,295 |
|
|
Deferred:
|
|
|
|
|
|
|
|
|
|
|
|
|
|
Federal
|
|
|
(3,092 |
) |
|
|
174 |
|
|
|
3,413 |
|
|
State
|
|
|
(381 |
) |
|
|
(124 |
) |
|
|
85 |
|
|
Foreign
|
|
|
(39 |
) |
|
|
(156 |
) |
|
|
8 |
|
|
Total deferred
|
|
|
(3,512 |
) |
|
|
(106 |
) |
|
|
3,506 |
|
|
Income tax expense
|
|
$ |
8,162 |
|
|
$ |
12,696 |
|
|
$ |
20,801 |
|
The following is a reconciliation of expected income tax expense (benefit) (computed by applying the federal statutory income tax rate to income before taxes) to actual income tax expense (benefit) (in thousands):
| |
|
2019
|
|
|
2018
|
|
|
2017
|
|
| |
|
|
|
|
|
|
|
|
|
|
|
|
|
|
|
|
|
|
|
|
|
|
|
|
|
Expected income tax expense
|
|
$ |
7,111 |
|
|
|
21.0 |
% |
|
$ |
13,739 |
|
|
|
28.0 |
% |
|
$ |
19,947 |
|
|
|
35.0 |
% |
|
State income taxes, net of federal income tax
|
|
|
737 |
|
|
|
2.2 |
% |
|
|
1,263 |
|
|
|
2.6 |
% |
|
|
1,403 |
|
|
|
2.5 |
% |
|
Valuation allowance
|
|
|
602 |
|
|
|
1.8 |
% |
|
|
42 |
|
|
|
0.1 |
% |
|
|
329 |
|
|
|
0.6 |
% |
|
Re-measurement of deferred taxes
|
|
|
- |
|
|
|
0.0 |
% |
|
|
(2,651 |
) |
|
|
-5.4 |
% |
|
|
- |
|
|
|
- |
|
|
Section 199 Qualified Production Activities deduction
|
|
|
- |
|
|
|
0.0 |
% |
|
|
(678 |
) |
|
|
-1.4 |
% |
|
|
(999 |
) |
|
|
-1.8 |
% |
|
Section 250 Foreign Derived Intangible Income deduction
|
|
|
(161 |
) |
|
|
-0.5 |
% |
|
|
- |
|
|
|
0.0 |
% |
|
|
- |
|
|
|
0.0 |
% |
|
Unrecognized tax expense (benefit)
|
|
|
26 |
|
|
|
0.1 |
% |
|
|
55 |
|
|
|
0.1 |
% |
|
|
(48 |
) |
|
|
-0.1 |
% |
|
Stock-based compensation - forfeitures and exercises
|
|
|
184 |
|
|
|
0.5 |
% |
|
|
570 |
|
|
|
1.2 |
% |
|
|
- |
|
|
|
- |
|
|
Other, net
|
|
|
(337 |
) |
|
|
-1.0 |
% |
|
|
356 |
|
|
|
0.7 |
% |
|
|
169 |
|
|
|
0.3 |
% |
|
Actual income tax expense
|
|
$ |
8,162 |
|
|
|
24.1 |
% |
|
$ |
12,696 |
|
|
|
25.9 |
% |
|
$ |
20,801 |
|
|
|
36.5 |
% |
The significant components of deferred tax assets recorded within the consolidated balance sheet were as follows (in thousands):
| |
|
2019
|
|
|
2018
|
|
|
Deferred tax assets:
|
|
|
|
|
|
|
|
|
|
Employee compensation accruals
|
|
$ |
2,697 |
|
|
$ |
2,729 |
|
|
Stock-based compensation
|
|
|
715 |
|
|
|
933 |
|
|
Deferred rent credits
|
|
|
4,184 |
|
|
|
4,407 |
|
|
Net operating loss carryforwards
|
|
|
4,259 |
|
|
|
3,959 |
|
|
Property, plant and equipment
|
|
|
1,021 |
|
|
|
- |
|
|
Goodwill
|
|
|
77 |
|
|
|
328 |
|
|
Reserves
|
|
|
863 |
|
|
|
247 |
|
|
Other, net
|
|
|
1,401 |
|
|
|
1,460 |
|
|
Subtotal deferred tax assets
|
|
|
15,217 |
|
|
|
14,063 |
|
|
Less: Valuation allowance
|
|
|
(3,197 |
) |
|
|
(2,527 |
) |
|
Total net deferred tax assets
|
|
$ |
12,020 |
|
|
$ |
11,536 |
|
ETHAN ALLEN INTERIORS INC. AND SUBSIDIARIES
The significant components of deferred tax liabilities recorded within the consolidated balance sheet were as follows (in thousands)
| |
|
2019
|
|
|
2018
|
|
|
Property, plant and equipment
|
|
$ |
- |
|
|
$ |
2,827 |
|
|
Intangible assets other than goodwill
|
|
|
9,007 |
|
|
|
8,951 |
|
|
Commissions
|
|
|
1,974 |
|
|
|
2,230 |
|
|
Total deferred tax liability
|
|
$ |
10,981 |
|
|
$ |
14,008 |
|
The deferred tax balances are classified in the consolidated balance sheets as follows at June 30 (in thousands):
| |
|
2019
|
|
|
2018
|
|
|
Non-current assets
|
|
$ |
2,108 |
|
|
$ |
1,688 |
|
|
Non-current liabilities
|
|
|
1,069 |
|
|
|
4,160 |
|
|
Total net deferred tax asset (liability)
|
|
$ |
1,039 |
|
|
$ |
(2,472 |
) |
Commencing with fiscal 2018 the Company is prospectively reporting its deferred tax assets and liabilities as non-current in conformance with ASU 2015-17, Balance Sheet Classification of Deferred Tax Assets. Prior to that, current deferred tax assets and liabilities and non-current deferred tax assets and liabilities were presented net in the consolidated balance sheets.
We evaluate our deferred tax assets to determine if the “more likely than not” standard of evidence has not been met thereby supporting the need for a valuation allowance. A valuation allowance must be established for deferred tax assets when it is not more likely than not that assets will be realized. At June 30, 2019, such an allowance was in place against the Belgian and Canadian foreign tax assets, and totaled $3.2 million compared to $2.5 million at June 30, 2018.
The Company’s deferred income tax assets at June 30, 2019 with respect to the net operating losses expire as follows (in thousands):
| |
|
Deferred Income
|
|
|
Net Operating Loss
|
|
| |
|
Tax Assets
|
|
|
Carryforwards
|
|
|
United States (federal and state), expiring between 2023 and 2032
|
|
$ |
1,168 |
|
|
$ |
20,662 |
|
|
Foreign, expiring between 2034 and 2039
|
|
$ |
3,091 |
|
|
$ |
9,566 |
|
Deferred federal income taxes were previously not provided for unremitted foreign earnings of our foreign subsidiaries because we expected those earnings to be indefinitely reinvested. As part of the Tax Act, the Company reported the Deemed Repatriation Transition Tax (the “Transition Tax”) on previously untaxed accumulated earnings and profits (“E&P”) of certain of our foreign subsidiaries. To determine the amount of the Transition Tax, we determined, in addition to other factors, the amount of post- 1986 E&P of the relevant subsidiaries, as well as the amount of non-U.S. income taxes paid on such earnings. We reported a Transition Tax obligation of $0.1 million for the fiscal year ended June 30, 2018.
On December 22, 2017, the Tax Act was enacted. Among the significant changes to the United States Internal Revenue Code, the Tax Act lowered the United States federal corporate income tax rate (“Federal Tax Rate”) from 35% to 21% effective January 1, 2018, introduced a limitation on the deduction of certain interest expenses, introduced a deduction for certain business capital expenditures and introduced a system of taxing foreign-sourced income from multinational corporations. The Company computed its income tax expense for the 2018 fiscal year using a blended Federal Tax Rate of 28%. The 21% Federal Tax Rate applies to fiscal years ending June 30, 2019 and each year thereafter. The Company re-measured its net deferred tax assets and liabilities using the Federal Tax Rate that would apply when these amounts were expected to reverse. At June 30, 2018, the Company’s re-measurement of its deferred tax assets and liabilities resulted in a discrete tax benefit $2.7 million, which lowered the effective tax rate by 5.4% for that fiscal year.
Uncertain Tax Positions
We recognize interest and penalties related to income tax matters as a component of income tax expense. If the $2.2 million of unrecognized tax benefits and related interest and penalties as of June 30, 2019 were recognized, approximately $1.7 million would be recorded as a benefit to income tax expense.
ETHAN ALLEN INTERIORS INC. AND SUBSIDIARIES
A reconciliation of the beginning and ending amount of unrecognized tax benefits including related interest and penalties as of June 30, 2019 and 2018 is as follows (in thousands):
| |
|
2019
|
|
|
2018
|
|
|
Beginning balance
|
|
$ |
2,187 |
|
|
$ |
2,106 |
|
|
Additions for tax positions taken during the current year
|
|
|
329 |
|
|
|
360 |
|
|
Additions for tax positions taken during the prior year
|
|
|
143 |
|
|
|
107 |
|
|
Reductions for tax positions taken in prior years
|
|
|
(450 |
) |
|
|
(386 |
) |
|
Decreases related to settlements with taxing authorities
|
|
|
- |
|
|
|
- |
|
|
Ending balance
|
|
$ |
2,209 |
|
|
$ |
2,187 |
|
It is reasonably possible that various issues relating to approximately $0.6 million of the total gross unrecognized tax benefits as of June 30, 2019 will be resolved within the next twelve months as exams are completed or statutes expire. If recognized, approximately $0.6 million of unrecognized tax benefits would reduce our tax expense in the period realized. However, actual results could differ from those currently anticipated.
The Company conducts business globally and, as a result, the Company or one or more of its subsidiaries files income tax returns in the United States, various state, and foreign jurisdictions. In the normal course of business, the Company is subject to examination by the taxing authorities in such major jurisdictions as the United States, Canada, Mexico, Belgium and Honduras. As of June 30, 2019, the Company and certain subsidiaries are currently under audit from 2015 through 2017 in the United States. While the amount of uncertain tax benefits with respect to the entities and years under audit may change within the next twelve months, it is not anticipated that any of the changes will be significant.
|
(14)
|
Shareholders’ Equity
|
Shares Authorized for Issuance
Our authorized capital stock consists of 150,000,000 shares of common stock, par value $0.01 per share, and 1,055,000 shares of Preferred Stock, par value $0.01 per share. The Board of Directors may provide for the issuance of all or any shares of Preferred Stock in one or more classes or series, and to fix for each such class or series such voting powers, full or limited, or no voting powers, and such distinctive designations, preferences and relative, participating, optional or other special rights and such qualifications, limitations or restrictions thereof, as shall be stated and expressed in the resolution or resolutions adopted by the Board of Directors providing for the issuance of such class or series and as may be permitted by the General Corporation Law of the State of Delaware. As of June 30, 2019 and 2018, there were no shares of Preferred Stock issued or outstanding.
Share Repurchase Program
At June 30, 2019, we had a remaining Board authorization to repurchase 2,518,046 shares of our common stock pursuant to our program. There is no expiration date on the repurchase authorization and the amount and timing of future share repurchases, if any, will be determined as market and business conditions warrant.
During the past three fiscal years, we repurchased the following shares of our common stock (trade date basis) under our existing share repurchase program:
| |
|
2019
|
|
|
2018
|
|
|
2017
|
|
|
Common shares repurchased
|
|
|
- |
|
|
|
950,484 |
|
|
|
357,363 |
|
|
Cost to repurchase common shares
|
|
$ |
- |
|
|
$ |
22,019,381 |
|
|
$ |
10,246,302 |
|
|
Average price per share
|
|
$ |
- |
|
|
$ |
23.17 |
|
|
$ |
28.67 |
|
For the fiscal years presented above, we funded our purchases of treasury stock with existing cash on hand, cash generated through current period operations and our credit facility. All our common stock repurchases are recorded as treasury stock and result in a reduction of shareholders’ equity.
ETHAN ALLEN INTERIORS INC. AND SUBSIDIARIES
Basic and diluted earnings per share are calculated using the following weighted average share data (in thousands):
| |
|
Years ended June 30,
|
|
| |
|
2019
|
|
|
2018
|
|
|
2017
|
|
|
Weighted average shares outstanding for basic calculation
|
|
|
26,695 |
|
|
|
27,321 |
|
|
|
27,679 |
|
|
Dilutive effect of stock options and other share-based awards
|
|
|
56 |
|
|
|
304 |
|
|
|
279 |
|
|
Weighted average shares outstanding adjusted for dilution calculation
|
|
|
26,751 |
|
|
|
27,625 |
|
|
|
27,958 |
|
Dilutive potential common shares consist of stock options and unvested restricted stock awards. In fiscal 2019, 2018 and 2017, stock options to purchase 231,717, 195,318, and 379,350 common shares, respectively, were excluded from the diluted EPS calculations because their inclusion would have been anti-dilutive.
As of June 30, 2019, 2018 and 2017, the number of performance-based equity award grants excluded from the calculation of diluted EPS was 187,882, 210,836 and 215,613, respectively. Performance-based awards are excluded from the calculation of diluted EPS unless the performance criteria are probable of being achieved as of the balance sheet date.
|
(16)
|
Accumulated Other Comprehensive Income (Loss)
|
The following table sets forth the activity in accumulated other comprehensive loss (in thousands):
| |
|
Years ended June 30,
|
|
| |
|
2019
|
|
|
2018
|
|
|
Beginning balance at July 1
|
|
$ |
(6,171 |
) |
|
$ |
(4,131 |
) |
|
Changes before reclassifications
|
|
|
520 |
|
|
|
(2,040 |
) |
|
Amounts reclassified from accumulated other comprehensive income
|
|
|
- |
|
|
|
- |
|
|
Current period other comprehensive income (loss)
|
|
|
520 |
|
|
|
(2,040 |
) |
|
Ending balance at June 30
|
|
$ |
(5,651 |
) |
|
$ |
(6,171 |
) |
Accumulated other comprehensive income consists of foreign currency translation adjustments which are the result of changes in foreign currency exchange rates related to our operations in Canada, Belgium, Honduras, and Mexico, and exclude income taxes given that the earnings of non-U.S. subsidiaries are deemed to be indefinitely reinvested.
|
(17)
|
Share-Based Compensation
|
Share-based compensation expense totaled $0.1 million, $1.0 million, and $1.3 million in fiscal 2019, 2018 and 2017, respectively. These amounts have been included in the consolidated statements of comprehensive income within selling, general and administrative expenses. During fiscal 2019, 2018, and 2017, we recognized related tax benefits associated with our share-based compensation arrangements totaling $0.1 million, $0.5 million, and $0.5 million, respectively (before valuation allowances). Such amounts have been included in the consolidated statements of comprehensive income within income tax expense. There was no stock-based compensation capitalized as of June 30, 2019 and 2018, respectively.
At June 30, 2019, we had 1,586,906 shares of common stock available for future issuance pursuant to the Ethan Allen Interiors Inc. Stock Incentive Plan (the “Plan”). Under this Plan, the aggregate number of shares of common stock that may be issued through awards of any form is 6,487,867 shares. The Plan provides for the grant of non-compensatory stock options to eligible employees and non-employee directors. Stock options under the Plan are non-qualified under section 422 of the Internal Revenue Code and allow for the purchase of shares of our common stock. The Plan also provides for the issuance of stock appreciation rights (“SARs”) on issued options, however no SARs have been issued to date. The option awards are approved by the Compensation Committee of the Board of Directors after consideration of recommendations proposed by the Chief Executive Officer. Options are generally granted with an exercise price equal to the market price of our common stock at the date of grant, vest ratably over a specified service period, and have a contractual term of 10 years. Equity awards can also include performance vesting conditions. Company policy further requires an additional one year holding period beyond the service vest date for certain executives. Beginning January 31, 2014, grants to employees include both company performance and service vesting conditions (as further described below). Grants to independent directors have a three year service vesting condition. The following is a description of equity grants made under the Plan.
ETHAN ALLEN INTERIORS INC. AND SUBSIDIARIES
Stock Option Awards
A summary of stock option activity during the fiscal year ended June 30, 2019 is presented below.
| |
|
|
|
|
|
|
|
|
|
Weighted
|
|
|
|
|
|
| |
|
|
|
|
|
Weighted
|
|
|
Average
|
|
|
|
|
|
| |
|
|
|
|
|
Average
|
|
|
Remaining
|
|
|
Aggregate
|
|
| |
|
|
|
|
|
Exercise
|
|
|
Contractual
|
|
|
Intrinsic Value
|
|
| |
|
Options
|
|
|
Price
|
|
|
Term (yrs)
|
|
|
($ in thousands)
|
|
|
Outstanding - June 30, 2018
|
|
|
561,595 |
|
|
$ |
21.70 |
|
|
|
|
|
|
|
|
|
|
Granted
|
|
|
25,590 |
|
|
$ |
23.45 |
|
|
|
|
|
|
|
|
|
|
Exercised
|
|
|
(52,250 |
) |
|
$ |
15.73 |
|
|
|
|
|
|
|
|
|
|
Canceled (forfeited/expired)
|
|
|
(156,024 |
) |
|
$ |
23.36 |
|
|
|
|
|
|
|
|
|
|
Outstanding - June 30, 2019
|
|
|
378,911 |
|
|
$ |
21.95 |
|
|
|
4.4 |
|
|
$ |
990 |
|
|
Exercisable - June 30, 2019
|
|
|
319,024 |
|
|
$ |
21.04 |
|
|
|
3.7 |
|
|
$ |
990 |
|
The aggregate intrinsic value of options exercised during fiscal 2019, 2018 and 2017 was $0.3 million, $0.1 million, and $0.8 million, respectively.
As of June 30, 2019, $0.2 million of total unrecognized compensation expense related to non-vested stock options is expected to be recognized over a weighted average period of 1.5 years. A summary of the nonvested shares as of June 30, 2019 and changes during the year then ended is presented below.
| |
|
|
|
|
|
Weighted Average
|
|
| |
|
Options
|
|
|
Exercise Price
|
|
|
Nonvested June 30, 2018
|
|
|
108,172 |
|
|
$ |
27.74 |
|
|
Granted
|
|
|
25,590 |
|
|
$ |
23.45 |
|
|
Vested
|
|
|
(63,436 |
) |
|
$ |
27.16 |
|
|
Canceled (forfeited/expired)
|
|
|
(10,439 |
) |
|
$ |
25.95 |
|
|
Nonvested at June 30, 2019
|
|
|
59,887 |
|
|
$ |
26.84 |
|
We estimate, as of the date of grant, the fair value of stock options awarded using the Black-Scholes option pricing model. Use of a valuation model requires management to make certain assumptions with respect to selected model inputs, including anticipated changes in the underlying stock price (i.e. expected volatility) and option exercise activity (i.e. expected life). Expected volatility is based on the historical volatility of our stock. The risk-free rate of return is based on the United States Treasury bill rate extrapolated to the term matching the expected life of the grant. The dividend yield is based on the annualized dividend rate at the grant date relative to the grant date stock price. The expected life of options granted, which represents the period of time that the options are expected to be outstanding, is based, primarily, on historical data.
There were no stock option awards granted to employees during each of the past three fiscal years. Non-employee (independent) directors were granted stock options each year and valued using the Black-Scholes option pricing model with the following weighted average assumptions:
| |
|
2019
|
|
|
2018
|
|
|
2017
|
|
|
Volatility
|
|
|
31.3 |
% |
|
|
31.5 |
% |
|
|
36.8 |
% |
|
Risk-free rate of return
|
|
|
2.80 |
% |
|
|
1.76 |
% |
|
|
1.03 |
% |
|
Dividend yield
|
|
|
3.24 |
% |
|
|
2.47 |
% |
|
|
1.96 |
% |
|
Expected average life (years)
|
|
|
5.0 |
|
|
|
4.6 |
|
|
|
5.0 |
|
|
Grant date fair value ($)
|
|
$ |
5.30 |
|
|
$ |
6.93 |
|
|
$ |
8.30 |
|
|
Fair value as a % of exercise price
|
|
|
22.6 |
% |
|
|
22.5 |
% |
|
|
23.9 |
% |
Stock Unit Awards
Under the Plan, the Compensation Committee of the Board of Directors was authorized to award common shares to certain employees based on the attainment of certain financial goals over a given performance period. The awards are offered at no cost to the employees. In the event of an employee's termination during the vesting period, the potential right to earn shares under this program is generally forfeited.
ETHAN ALLEN INTERIORS INC. AND SUBSIDIARIES
Payout of these grants depends on our financial performance (80%) and a market-based condition based on the total return our shareholders receive on their investment in our stock relative to returns earned through investments in other peer companies (20%). The performance award opportunity ranges from 50% of the employee's target award if minimum performance requirements are met to a maximum of 125% of the target award based on the attainment of certain financial and shareholder-return goals over a specific performance period, which is generally three fiscal years. The number of awards that will vest, as well as unearned and canceled awards, depend on the achievement of certain financial and shareholder-return goals over the three-year performance periods, and will be settled in shares if service conditions are met, requiring employees to remain employed with us through the end of the three-year performance periods. We account for stock unit awards as equity-based awards because upon vesting, they will be settled in common shares. We expense as compensation cost the fair value of the shares as of the grant date and amortize expense ratably over the total performance and time vest period, considering the probability that we will satisfy the performance goals.
The following table summarizes the performance-based stock units’ activity during fiscal 2019 at the maximum award amounts based upon the respective performance share agreements:
| |
|
|
|
|
|
Weighted Average
|
|
| |
|
|
|
|
|
Grant Date
|
|
| |
|
Units
|
|
|
Fair Value
|
|
|
Outstanding at June 30, 2018
|
|
|
330,369 |
|
|
$ |
26.15 |
|
|
Granted
|
|
|
105,644 |
|
|
$ |
18.33 |
|
|
Vested
|
|
|
(7,654 |
) |
|
$ |
26.79 |
|
|
Canceled (forfeited/expired)
|
|
|
(114,477 |
) |
|
$ |
28.02 |
|
|
Outstanding at June 30, 2019
|
|
|
313,882 |
|
|
$ |
22.82 |
|
We estimate, as of the date of grant, the fair value of Performance Units with a discounted cash flow model, using as model inputs the risk-free rate of return as the discount rate, dividend yield for dividends not paid during the restriction period, and a discount for lack of marketability for a one-year post-vest holding period. The lack of marketability discount used is the present value of a future put option using Monte-Carlo and Black-Scholes pricing models. The weighted average assumptions used for the fiscal years ended June 30 are noted in the following table.
| |
|
2019
|
|
|
2018
|
|
|
2017 |
|
|
Volatility
|
|
|
32.1 |
% |
|
|
32.9 |
% |
|
|
30.8 |
% |
|
Risk-free rate of return
|
|
|
2.72 |
% |
|
|
1.41 |
% |
|
|
0.92 |
% |
|
Dividend yield
|
|
|
3.24 |
% |
|
|
2.47 |
% |
|
|
1.97 |
% |
|
Expected average life (years)
|
|
|
3.0 |
|
|
|
1.9 |
|
|
|
2.0 |
|
Share-based compensation expenses related to performance-based shares recognized in our consolidated statements of comprehensive income are presented in the following table for the fiscal years ended June 30 (in thousands).
| |
|
2019
|
|
|
2018
|
|
|
2017
|
|
|
Fiscal 2016 grants
|
|
$ |
5 |
|
|
$ |
92 |
|
|
$ |
794 |
|
|
Fiscal 2017 grants
|
|
|
- |
|
|
|
(12 |
) |
|
|
12 |
|
|
Fiscal 2018 grants
|
|
|
(457 |
) |
|
|
457 |
|
|
|
- |
|
|
Fiscal 2019 grants
|
|
|
321 |
|
|
|
- |
|
|
|
- |
|
|
Total expense
|
|
$ |
(131 |
) |
|
$ |
537 |
|
|
$ |
806 |
|
As of June 30, 2019, we estimate $0.7 million of total unrecognized compensation cost related to outstanding stock units granted under the Plan. That cost is expected to be recognized over a weighted average period of 2.0 years.
Restricted Stock Awards
There was no restricted stock award activity during fiscal 2019. As of June 30, 2019 or 2018, there were no restricted stock awards outstanding, respectively.
ETHAN ALLEN INTERIORS INC. AND SUBSIDIARIES
|
(18)
|
Employee Retirement Programs
|
The Ethan Allen Retirement Savings Plan (the “401(k) Plan”)
The Company established its 401(k) Plan in 1994. The 401(k) Plan is a defined contribution plan covering all full-time, United States employees and is subject to the provisions of the Employee Retirement Income Security Act of 1974 and the Internal Revenue Code of 1986 (“IRC”). All United States employees of the Company are eligible to participate in the 401(k) Plan on the first day of any subsequent April, July, October or January coincident with or next following the three-month anniversary of their date of hire. Each year, participants may contribute up to 100% of their eligible annual compensation, subject to annual limitations established by the IRC. We may, at our discretion, make a matching and profit sharing contribution to the 401(k) Plan on behalf of each eligible participant, which vests immediately. The Company contributed $3.4 million, $3.4 million and $3.5 million in matching and profit sharing contributions to employee 401(k) accounts during fiscal 2019, 2018 and 2017, respectively.
Other Retirement Plans and Benefits
Ethan Allen provides additional benefits to selected members of management in the form of previously entered deferred compensation arrangements and a management cash bonus and other incentive programs. The total cost of these benefits was $0.7 million, $0.1 million, and $1.0 million in fiscal 2019, 2018 and 2017, respectively.
Operating segments are defined as (i) components of an enterprise that engage in business activities from which they may earn revenue and incur expense, (ii) have operating results that are regularly reviewed by the enterprise’s chief operating decision maker to make decisions about resources to be allocated to the segment and assess its performance, and (iii) for which discrete financial information is available. The Company’s Chief Executive Officer is its chief operating decision maker (“CODM”) and reviews financial information at the operating segment level and is responsible for making decisions about resources allocated amongst the operating segments based on actual results. Our operating segments are aligned with how the Company, including its CODM, manages the business. As such, our reportable operating segments are the Wholesale segment and the Retail segment.
Our wholesale and retail operating segments represent strategic business areas of our vertically integrated enterprise that operate separately and provide their own distinctive services. This vertical structure enables us to offer our complete line of home furnishings and accents more effectively while controlling quality and cost. We evaluate performance of the respective segments based upon revenues and operating income. Inter-segment transactions result, primarily, from the wholesale sale of inventory to the retail segment, including the related profit margin.
As of June 30, 2019, the Company operated 144 design centers (our retail segment) and our independent retailers operated 158 design centers. Our wholesale segment net sales include sales to our retail segment, which are eliminated in consolidation, and sales to our independent retailers. Our retail segment net sales accounted for 79% of our consolidated net sales in fiscal 2019. Our wholesale segment net sales to independent retailers and other third parties accounted for the remaining 21%. Our ten largest customers were all within our wholesale segment and represent 12.4% of our consolidated net sales in fiscal 2019. These customers are the GSA and nine independent retailers who operate 116 design centers.
ETHAN ALLEN INTERIORS INC. AND SUBSIDIARIES
Information for each of the last three fiscal years ended June 30 is provided below (in thousands):
| |
|
2019
|
|
|
2018
|
|
|
2017
|
|
|
Net sales
|
|
|
|
|
|
|
|
|
|
|
|
|
|
Wholesale segment
|
|
$ |
441,551 |
|
|
$ |
475,731 |
|
|
$ |
453,326 |
|
|
Retail segment
|
|
|
589,829 |
|
|
|
587,502 |
|
|
|
603,677 |
|
|
Elimination of inter-company sales
|
|
|
(284,696 |
) |
|
|
(296,449 |
) |
|
|
(293,618 |
) |
|
Consolidated Total
|
|
$ |
746,684 |
|
|
$ |
766,784 |
|
|
$ |
763,385 |
|
| |
|
|
|
|
|
|
|
|
|
|
|
|
|
Operating income
|
|
|
|
|
|
|
|
|
|
|
|
|
|
Wholesale segment
|
|
$ |
42,481 |
|
|
$ |
48,499 |
|
|
$ |
53,505 |
|
|
Retail segment
|
|
|
(10,529 |
) |
|
|
(1,738 |
) |
|
|
1,198 |
|
|
Adjustment of intercompany profit(1)
|
|
|
1,995 |
|
|
|
2,106 |
|
|
|
3,247 |
|
|
Consolidated Total
|
|
$ |
33,947 |
|
|
$ |
48,867 |
|
|
$ |
57,950 |
|
| |
|
|
|
|
|
|
|
|
|
|
|
|
|
Depreciation and amortization
|
|
|
|
|
|
|
|
|
|
|
|
|
|
Wholesale segment
|
|
$ |
7,560 |
|
|
$ |
7,752 |
|
|
$ |
7,550 |
|
|
Retail segment
|
|
|
12,077 |
|
|
|
12,079 |
|
|
|
12,565 |
|
|
Consolidated Total
|
|
$ |
19,637 |
|
|
$ |
19,831 |
|
|
$ |
20,115 |
|
| |
|
|
|
|
|
|
|
|
|
|
|
|
|
Capital expenditures
|
|
|
|
|
|
|
|
|
|
|
|
|
|
Wholesale segment
|
|
$ |
3,340 |
|
|
$ |
4,286 |
|
|
$ |
8,589 |
|
|
Retail segment
|
|
|
5,780 |
|
|
|
8,200 |
|
|
|
9,056 |
|
|
Consolidated Total
|
|
$ |
9,120 |
|
|
$ |
12,486 |
|
|
$ |
17,645 |
|
|
(1)
|
Represents the change in wholesale profit contained in Company-owned design center inventory at the end of the period.
|
| |
|
June 30,
|
|
|
($ in thousands)
|
|
2019
|
|
|
2018
|
|
|
2017
|
|
|
Total Assets
|
|
|
|
|
|
|
|
|
|
|
|
|
|
Wholesale segment
|
|
$ |
237,354 |
|
|
$ |
241,616 |
|
|
$ |
279,364 |
|
|
Retail segment
|
|
|
299,125 |
|
|
|
317,590 |
|
|
|
319,341 |
|
|
Inventory profit elimination(1)
|
|
|
(26,128 |
) |
|
|
(28,773 |
) |
|
|
(30,483 |
) |
|
Consolidated Total
|
|
$ |
510,351 |
|
|
$ |
530,433 |
|
|
$ |
568,222 |
|
|
(1)
|
The wholesale profit contained in the retail segment inventory that has not yet been realized. These profits are realized when the related inventory is sold.
|
Geographic Information
Our international net sales are comprised of our wholesale segment sales to independent retailers and our retail segment sales to consumers through the Company operated design centers.
The number of international design centers and the related net sales as a percent of our consolidated net sales is shown in the following table.
| |
|
Fiscal Year Ended June 30,
|
|
| |
|
2019
|
|
|
2018
|
|
|
2017
|
|
|
Independent design centers
|
|
|
118 |
|
|
|
104 |
|
|
|
107 |
|
|
Company operated design centers
|
|
|
6 |
|
|
|
6 |
|
|
|
6 |
|
|
Total international design centers
|
|
|
124 |
|
|
|
110 |
|
|
|
113 |
|
|
% of total design centers international
|
|
|
41.1 |
% |
|
|
37.2 |
% |
|
|
37.3 |
% |
|
% of consolidated net sales
|
|
|
6.8 |
% |
|
|
10.2 |
% |
|
|
10.0 |
% |
|
Sales by Country
|
|
2019
|
|
|
2018
|
|
|
2017
|
|
|
United States
|
|
|
93.2 |
% |
|
|
89.8 |
% |
|
|
90.0 |
% |
|
All Others
|
|
|
6.8 |
% |
|
|
10.2 |
% |
|
|
10.0 |
% |
ETHAN ALLEN INTERIORS INC. AND SUBSIDIARIES
The following table sets forth long-lived assets by geographic area at June 30 (in thousands):
| |
|
2019
|
|
|
2018
|
|
|
2017
|
|
|
United States
|
|
$ |
218,034 |
|
|
$ |
239,567 |
|
|
$ |
239,885 |
|
|
Mexico
|
|
|
18,144 |
|
|
|
18,323 |
|
|
|
20,142 |
|
|
Honduras
|
|
|
8,057 |
|
|
|
8,637 |
|
|
|
9,011 |
|
|
Canada
|
|
|
1,011 |
|
|
|
1,376 |
|
|
|
1,160 |
|
|
Total long-lived assets(1)
|
|
$ |
245,246 |
|
|
$ |
267,903 |
|
|
$ |
270,198 |
|
|
(1)
|
Long-lived assets consist of property, plant and equipment, net of accumulated depreciation and amortization and exclude goodwill, intangible assets, deferred taxes and other assets.
|
|
(20)
|
Commitments and Contingencies
|
Commitments represent obligations, such as those for future purchases of goods or services that are not yet recorded on the balance sheet as liabilities. We record liabilities for commitments when incurred (i.e., when the goods or services are received).
Lease Commitments
We lease real property and equipment under various operating lease agreements expiring at various times through 2039. Of the 144 Company operated retail design centers, 94 of the properties were leased as of June 30, 2019. Leases covering these retail design center locations and other equipment may require, in addition to stated minimums, contingent rentals based on retail sales or equipment usage. Generally, the leases provide for renewal for various periods at stipulated rates.
Total minimum rental payments associated with our leases are recorded as rent expense (a component of Selling, General & Administrative expenses) on a straight-line basis over the periods of the respective non-cancelable lease terms. Future minimum lease payments under non-cancelable operating leases for each of the five fiscal years subsequent to June 30, 2019, and thereafter are shown in the table below. Also shown are minimum future rentals from subleases, which will partially offset lease payments in the aggregate (in thousands):
| |
|
Future Minimum
|
|
|
Future Minimum
|
|
|
Fiscal Year Ended June 30,
|
|
Lease Payments
|
|
|
Sublease Rentals
|
|
|
2020
|
|
$ |
33,761 |
|
|
$ |
1,800 |
|
|
2021
|
|
|
30,534 |
|
|
|
1,611 |
|
|
2022
|
|
|
26,443 |
|
|
|
1,491 |
|
|
2023
|
|
|
20,276 |
|
|
|
1,055 |
|
|
2024
|
|
|
15,345 |
|
|
|
403 |
|
|
2025 and thereafter
|
|
|
43,500 |
|
|
|
721 |
|
|
Total
|
|
$ |
169,859 |
|
|
$ |
7,081 |
|
Total rent expense for each of the past three fiscal years ended June 30 was as follows (in thousands):
| |
|
2019
|
|
|
2018
|
|
|
2017
|
|
|
Basic rentals under operating leases
|
|
$ |
34,378 |
|
|
$ |
33,734 |
|
|
$ |
33,033 |
|
|
Contingent rentals under operating leases
|
|
|
76 |
|
|
|
133 |
|
|
|
142 |
|
|
Basic and contingent rentals
|
|
|
34,454 |
|
|
|
33,867 |
|
|
|
33,175 |
|
|
Less: sublease rent
|
|
|
(2,060 |
) |
|
|
(1,853 |
) |
|
|
(1,824 |
) |
|
Total rent expense
|
|
$ |
32,394 |
|
|
$ |
32,014 |
|
|
$ |
31,351 |
|
Deferred rent credits and deferred lease incentives are reflected in the consolidated balance sheets under the caption Other long-term liabilities, and are amortized over the respective underlying lease terms on a straight-line basis as a reduction of rent expense. Amounts recorded at June 30 are as follows (in thousands):
| |
|
2019
|
|
|
2018
|
|
|
Deferred rent credits
|
|
$ |
11,987 |
|
|
$ |
13,488 |
|
|
Deferred lease incentives
|
|
|
5,143 |
|
|
|
4,532 |
|
| |
|
$ |
17,130 |
|
|
$ |
18,020 |
|
ETHAN ALLEN INTERIORS INC. AND SUBSIDIARIES
Purchase Commitments with Suppliers
Purchase obligations are defined as agreements that are enforceable and legally binding that specify all significant terms, including fixed or minimum quantities to be purchased; fixed, minimum or variable price provisions; and the approximate timing of the transaction. We do, in the normal course of business, regularly initiate purchase orders for the procurement of (i) selected finished goods sourced from third-party suppliers, (ii) lumber, fabric, leather and other raw materials used in production, and (iii) certain outsourced services. All purchase orders are based on current needs and are fulfilled by suppliers within short time periods. At June 30, 2019, our open purchase orders with respect to such goods and services totaled $23.9 million and are to be paid in less than one year. Other purchase commitments included within this table represent payment due for other services such as telecommunication, computer-related software, royalties, web development, insurance and other maintenance contracts. There were no material changes in our purchase commitments with suppliers during fiscal 2019.
Legal Matters
We are routinely party to various legal proceedings, including investigations or as a defendant in litigation, in the ordinary course of business. We are also subject to various federal, state and local environmental protection laws and regulations and are involved, from time to time, in investigations and proceedings regarding environmental matters. Such investigations and proceedings typically concern air emissions, water discharges, and/or management of solid and hazardous wastes. Under these laws, we and/or our subsidiaries are, or may be, required to remove or mitigate the effects on the environment of the disposal or release of certain hazardous materials.
Regulations issued under the Clean Air Act Amendments of 1990 required the industry to reformulate certain furniture finishes or institute process changes to reduce emissions of volatile organic compounds. Compliance with many of these requirements has been facilitated through the introduction of high solids coating technology and alternative formulations. In addition, we have instituted a variety of technical and procedural controls, including reformulation of finishing materials to reduce toxicity, implementation of high velocity low pressure spray systems, development of storm water protection plans and controls, and further development of related inspection/audit teams, all of which have served to reduce emissions per unit of production. We remain committed to implementing new waste minimization programs and/or enhancing existing programs with the objective of (i) reducing the total volume of waste, (ii) limiting the liability associated with waste disposal, and (iii) continuously improving environmental and job safety programs on the factory floor which serve to minimize emissions and safety risks for employees. To reduce the use of hazardous materials in the manufacturing process, we will continue to evaluate the most appropriate, cost-effective control technologies for finishing operations and production methods. We believe that our facilities are in material compliance with all such applicable laws and regulations. Our currently anticipated capital expenditures for environmental control facility matters are not material.
On a quarterly basis, we review our litigation activities and determine if an unfavorable outcome to us is considered “remote”, “reasonably possible” or “probable” as defined by ASC 450, Contingencies. Where we determine an unfavorable outcome is probable and is reasonably estimable, we accrue for potential litigation losses. The liability we may ultimately incur with respect to such litigation matters, in the event of a negative outcome, may be in excess of amounts currently accrued, if any; however, we do not expect that the reasonably possible outcome of these litigation matters would, individually or in the aggregate, have a material adverse effect on our financial condition, results of operations or cash flows. Where we determine an unfavorable outcome is not probable or reasonably estimable, we do not accrue for any potential litigation loss.
Although the outcome of the various claims and proceedings against us cannot be predicted with certainty, management believes that the likelihood is remote that any existing claims or proceedings, individually or in the aggregate, will have a material adverse effect on our financial position, results of operations or cash flows.
Indemnifications
As permitted or required under Delaware law and to the maximum extent allowable under that law, the Company has certain obligations to indemnify its current and former officers and directors for certain events or occurrences while the officer or director is, or was serving, at our request in such capacity. These indemnification obligations are valid as long as the director or officer acted in good faith and in a manner the person reasonably believed to be in, or not opposed to, the best interests of the Company, and with respect to any criminal action or proceeding, had no reasonable cause to believe his or her conduct was unlawful. The maximum potential amount of future payments Ethan Allen could be required to make under these indemnification obligations is unlimited; however, the Company has a director and officer insurance policy that it believes mitigates our exposure and may enable us to recover a portion of any future amounts paid. We believe the estimated fair value of these indemnification obligations is immaterial.
ETHAN ALLEN INTERIORS INC. AND SUBSIDIARIES
|
(21)
|
Quarterly Financial Data (Unaudited)
|
The following table presents selected unaudited financial information for each of the quarterly periods in the years ended June 30, 2019 and 2018. The results for any quarter are not necessarily indicative of future quarterly results and, accordingly, period-to-period comparisons should not be relied upon as an indication of future performance (in thousands, except per share data):
| |
|
Quarter Ended
|
|
|
Fiscal 2019
|
|
September 30 (Q1)
|
|
|
December 31 (Q2)
|
|
|
March 31 (Q3)
|
|
|
June 30 (Q4)
|
|
|
Net sales
|
|
$ |
187,785 |
|
|
$ |
197,152 |
|
|
$ |
177,829 |
|
|
$ |
183,918 |
|
|
Gross profit
|
|
$ |
101,450 |
|
|
$ |
108,860 |
|
|
$ |
98,394 |
|
|
$ |
100,787 |
|
|
Operating income (loss)
|
|
$ |
11,799 |
|
|
$ |
16,128 |
|
|
$ |
10,669 |
|
|
$ |
(4,649 |
) |
|
Net Income (loss)
|
|
$ |
8,840 |
|
|
$ |
12,190 |
|
|
$ |
7,978 |
|
|
$ |
(3,310 |
) |
|
Earnings (loss) per basic share
|
|
$ |
0.33 |
|
|
$ |
0.46 |
|
|
$ |
0.30 |
|
|
$ |
(0.12 |
) |
|
Earnings (loss) per diluted share
|
|
$ |
0.33 |
|
|
$ |
0.45 |
|
|
$ |
0.30 |
|
|
$ |
(0.12 |
) |
|
Diluted weighted average common shares
|
|
|
26,940 |
|
|
|
26,923 |
|
|
|
26,751 |
|
|
|
26,758 |
|
|
Dividends declared per common share
|
|
$ |
0.19 |
|
|
$ |
1.19 |
|
|
$ |
0.19 |
|
|
$ |
0.19 |
|
| |
|
Quarter Ended
|
|
|
Fiscal 2018
|
|
September 30 (Q1)
|
|
|
December 31 (Q2)
|
|
|
March 31 (Q3)
|
|
|
June 30 (Q4)
|
|
|
Net sales
|
|
$ |
181,302 |
|
|
$ |
198,481 |
|
|
$ |
181,419 |
|
|
$ |
205,582 |
|
|
Gross profit
|
|
$ |
100,323 |
|
|
$ |
107,791 |
|
|
$ |
96,708 |
|
|
$ |
111,142 |
|
|
Operating income
|
|
$ |
11,549 |
|
|
$ |
17,538 |
|
|
$ |
3,873 |
|
|
$ |
15,907 |
|
|
Net Income
|
|
$ |
7,415 |
|
|
$ |
14,862 |
|
|
$ |
2,616 |
|
|
$ |
11,478 |
|
|
Earnings per basic share
|
|
$ |
0.27 |
|
|
$ |
0.54 |
|
|
$ |
0.10 |
|
|
$ |
0.43 |
|
|
Earnings per diluted share
|
|
$ |
0.27 |
|
|
$ |
0.54 |
|
|
$ |
0.09 |
|
|
$ |
0.42 |
|
|
Diluted weighted average common shares
|
|
|
27,756 |
|
|
|
27,728 |
|
|
|
27,692 |
|
|
|
27,323 |
|
|
Dividends declared per common share
|
|
$ |
0.19 |
|
|
$ |
0.50 |
|
|
$ |
0.19 |
|
|
$ |
0.19 |
|
ETHAN ALLEN INTERIORS INC. AND SUBSIDIARIES
ITEM 9. CHANGES IN AND DISAGREEMENTS WITH ACCOUNTANTS ON ACCOUNTING AND FINANCIAL DISCLOSURE
None.
ITEM 9A. CONTROLS AND PROCEDURES
Disclosure Controls and Procedures
We maintain disclosure controls and procedures that are designed to ensure that information required to be disclosed in our Exchange Act reports is recorded, processed, summarized and reported within the time periods specified in the SEC’s rules and forms, and that such information is accumulated and communicated to our management, including our Chairman of the Board and Chief Executive Officer (“CEO”) and Executive Vice President Administration, Chief Financial Officer and Treasurer (“CFO”), as appropriate, to allow timely decisions regarding required financial disclosure.
Under the supervision and with the participation of our management, including the CEO and CFO, we have evaluated the effectiveness of the design and operation of our disclosure controls and procedures pursuant to Rules 13a-15(e) and 15d-15(e) under the Exchange Act, as of the end of the period covered by this report. Based on that evaluation, the CEO and CFO have concluded that, as of June 30, 2019, our disclosure controls and procedures are effective to ensure that information relating to us (including our consolidated subsidiaries), which is required to be disclosed by us in reports that we file or submit under the Exchange Act is recorded, processed, summarized and reported within the time periods specified in the SEC’s rules and forms, and is accumulated and communicated to our management, including the CEO and CFO, as appropriate, to allow timely decisions regarding required disclosure.
Management's Report on Internal Control over Financial Reporting
Management’s report on our internal control over financial reporting is included under Part II, Item 8 of the Annual Report on Form 10-K.
Report of Independent Registered Public Accounting Firm
Our independent registered public accounting firm’s attestation report on our internal control over financial reporting is included under Part II, Item 8 of this Annual Report on Form 10-K.
Changes in Internal Control over Financial Reporting
There have been no changes in our internal control over financial reporting (as such term is defined in Rules 13a-15(f) and 15d-15(f) under the Exchange Act) during the fiscal quarter ended June 30, 2019 that has materially affected, or are reasonably likely to materially affect, our internal control over financial reporting.
ITEM 9B. OTHER INFORMATION
None.
ETHAN ALLEN INTERIORS INC. AND SUBSIDIARIES
PART III
ITEM 10. DIRECTORS, EXECUTIVE OFFICERS AND CORPORATE GOVERNANCE
Code of Ethics
We have adopted a Code of Ethics that applies to our principal executive officer, principal financial officer, principal accounting officer or controller, all other officers and our directors. A copy of this code of conduct is available at our website at www.ethanallen.com/governance. We intend to disclose any amendment of our Code of Ethics, or any waiver of any provision thereof, on our website within four days of the date of such amendment or waiver. In the case of a waiver, the nature of the waiver, the name of the person to whom the waiver was granted, and the date of the waiver will also be disclosed.
Information contained on, or connected to, our website is not incorporated by reference into this Annual Report on Form 10-K and should not be considered part of this or any other report that we file with, or furnish to, the SEC.
Identification of Executive Officers
The information required relating to our executive officers is included under the heading Information About our Executive Officers in Part I, Item 1 of this Annual Report on Form 10-K and all of that information is incorporated in this item by reference.
The remaining information required by this Item will be included in our proxy statement for our 2019 Annual Meeting of Stockholders and is incorporated in this item by reference.
ITEM 11. EXECUTIVE COMPENSATION
The information required by this item will be included in our proxy statement for our 2019 Annual Meeting of Stockholders and is incorporated in this item by reference.
ITEM 12. SECURITY OWNERSHIP OF CERTAIN BENEFICIAL OWNERS AND MANAGEMENT AND RELATED STOCKHOLDER MATTERS
Security Ownership of Certain Beneficial Owners and Management
The information required by this item relating to security ownership of certain beneficial owners and management will be included under the caption Security Ownership of Common Stock of Certain Beneficial Owners and Management in our proxy statement for our 2019 Annual Meeting of Stockholders and is incorporated herein by reference.
Equity Compensation Plan Information
The following table summarizes as of June 30, 2019, the number of outstanding equity awards granted to employees and non-employee directors, as well as the number of equity awards remaining available for future issuance, under our equity compensation plans:
|
Plan Category
|
(a)
Number of securities to
be issued upon exercise
of outstanding options,
warrants and rights
|
(b)
Weighted average
exercise price of
outstanding options,
warrants and rights
|
(c)
Number of securities remaining
available for future issuance under
equity compensation plans (excluding
securities reflected in the first column)
|
|
Equity compensation plans approved by security holders
|
692,793(1)
|
$21.95(2)
|
1,586,906
|
|
Equity compensation plans not approved by security holders(3)
|
-
|
-
|
-
|
|
Total
|
692,793
|
$21.95
|
1,586,906
|
| |
(1)
|
Amount includes stock options outstanding under the Company’s Stock Incentive Plan as well as unvested shares of restricted stock and vested stock units which have been provided for under the provisions of the option plan.
|
| |
(2)
|
Calculated without taking into account shares of Company common stock subject to outstanding stock unit awards that will become issuable as they vest, without any cash consideration or other payment required for such shares.
|
| |
(3)
|
As of June 30, 2019, we did not maintain any equity compensation plans that have not been approved by our shareholders.
|
ETHAN ALLEN INTERIORS INC. AND SUBSIDIARIES
ITEM 13. CERTAIN RELATIONSHIPS AND RELATED TRANSACTIONS, AND DIRECTOR INDEPENDENCE
The information required by this item will be included in our proxy statement for our 2019 Annual Meeting of Stockholders and is incorporated in this item by reference.
ITEM 14. PRINCIPAL ACCOUNTING FEES AND SERVICES
The information required by this item will be included in our proxy statement for our 2019 Annual Meeting of Stockholders and is incorporated in this item by reference.
PART IV
ITEM 15. EXHIBITS, FINANCIAL STATEMENT SCHEDULES
(a) The following documents are filed as part of this Annual Report on Form 10-K:
| |
(1)
|
Financial Statements.
|
The following financial statements are included in Part II, Item 8 of this Annual Report on Form 10-K:
| |
-
|
Management’s Report on Internal Control over Financial Reporting
|
| |
-
|
Report of Independent Registered Public Accounting Firm
|
| |
-
|
Consolidated Balance Sheets at June 30, 2019 and 2018
|
| |
-
|
Consolidated Statements of Comprehensive Income for the years ended June 30, 2019, 2018 and 2017
|
| |
-
|
Consolidated Statements of Cash Flows for the years ended June 30, 2019, 2018 and 2017
|
| |
-
|
Consolidated Statements of Shareholders’ Equity for the years ended June 30, 2019, 2018 and 2017
|
| |
-
|
Notes to the Consolidated Financial Statements
|
| |
(2)
|
Financial Statement Schedules.
|
Separate financial statement schedules have been omitted either because they are not applicable or because the required information is included in the consolidated financial statements or notes described in Item 15(a)(1) above.
The information required by this item is set forth below.
ETHAN ALLEN INTERIORS INC. AND SUBSIDIARIES
|
3.9
|
|
Amended and Restated By-laws of Ethan Allen Inc. (now known as Ethan Allen Retail, Inc.)
|
|
S-4
|
333-131539-06
|
3(h)
|
2/3/2006
|
-
|
|
3.10
|
|
Certificate of Incorporation of Ethan Allen Manufacturing Corporation (now known as Ethan Allen Operations, Inc.)
|
|
S-4
|
333-131539-06
|
3(i)
|
2/3/2006
|
-
|
|
3.11
|
|
Certificate of Amendment of Certificate of Incorporation of Ethan Allen Manufacturing Corporation (now known as Ethan Allen Operations, Inc.)
|
|
S-4
|
333-131539-06
|
3(i)-1
|
2/3/2006
|
-
|
|
3.12
|
|
By-laws of Ethan Allen Manufacturing Corporation (now known as, Ethan Allen Operations, Inc.)
|
|
S-4
|
333-131539-06
|
3(j)
|
2/3/2006
|
-
|
|
3.13
|
|
Certificate of Formation of Ethan Allen Realty, LLC
|
|
S-4
|
333-131539-06
|
3(k)
|
2/3/2006
|
-
|
|
3.14
|
|
Limited Liability Company Operating Agreement of Ethan Allen Realty, LLC
|
|
S-4
|
333-131539-06
|
3(l)
|
2/3/2006
|
-
|
|
3.15
|
|
Amendment No. 1 to Operating Agreement of Ethan Allen Realty, LLC as of June 30, 2005
|
|
S-4
|
333-131539-06
|
3(l)-1
|
2/3/2006
|
-
|
|
3.16
|
|
Certificate of Incorporation of Lake Avenue Associates, Inc.
|
|
S-4
|
333-131539-06
|
3(m)
|
2/3/2006
|
-
|
|
3.17
|
|
By-laws of Lake Avenue Associates, Inc.
|
|
S-4
|
333-131539-06
|
3(n)
|
2/3/2006
|
-
|
|
3.18
|
|
Certificate of Incorporation of Manor House, Inc.
|
|
S-4
|
333-131539-06
|
3(o)
|
2/3/2006
|
-
|
|
3.19
|
|
Restated By-laws of Manor House, Inc.
|
|
S-4
|
333-131539-06
|
3(p)
|
2/3/2006
|
-
|
|
4.1
|
|
Description of Securities
|
|
-
|
-
|
-
|
-
|
X
|
|
10.1
|
|
Restated Directors Indemnification Agreement dated March 1993, among the Company and Ethan Allen and their Directors (incorporated by reference to Exhibit 10(c) to the Registration Statement on Form S-1 of the Company filed with the SEC on March 16, 1993)
|
|
S-1
|
33-57216
|
10(c)
|
3/16/1993
|
-
|
|
10.2*
|
|
The Ethan Allen Retirement Savings Plan as Amended and Restated, effective January 1, 2006
|
|
10-Q
|
001-11692
|
10(b)-7
|
11/5/2007
|
-
|
|
10.3
|
|
Sales Finance Agreement, dated June 25, 1999, between the Company and MBNA America Bank, N.A.
|
|
10-K
|
001-11692
|
10(j)
|
9/13/2000
|
-
|
|
10.4
|
|
Second Amended and Restated Private Label Consumer Credit Card Program Agreement, dated as of July 23, 2007, by and between Ethan Allen Global, Inc., Ethan Allen Retail, Inc. and GE Money Bank
|
|
10-Q
|
001-11692
|
10(e)-3
|
11/5/2007
|
-
|
|
10.5
|
|
First Amendment to Second Amended and Restated Private Label Consumer Credit Card Program Agreement, dated as of July 25, 2008, by and between Ethan Allen Global, Inc., Ethan Allen Retail, Inc. and GE Money Bank
|
|
10-Q
|
001-11692
|
10(e)-1
|
5/10/2010
|
-
|
|
10.6
|
|
Second Amendment to Second Amended and Restated Private Label Consumer Credit Card Program Agreement, dated as of February 16, 2010, by and between Ethan Allen Global, Inc., Ethan Allen Retail, Inc. and GE Money Bank
|
|
10-Q
|
001-11692
|
10(e)-2
|
5/10/2010
|
-
|
|
10.7
|
|
Third Amendment to Second Amended and Restated Private Label Consumer Credit Card Program Agreement, dated as of June 30, 2011, by and between Ethan Allen Global, Inc., Ethan Allen Retail, Inc. and GE Money Bank
|
|
10-Q
|
001-11692
|
10(e)-3
|
11/3/2010
|
-
|
|
10.8
|
|
Fourth Amendment to Second Amended and Restated Private Label Consumer Credit Card Program Agreement dated as of January 1, 2014, by and between Ethan Allen Global, Inc., Ethan Allen Retail, Inc., and GE Capital Retail Bank
|
|
10-Q
|
001-11692
|
10(d)-4
|
1/31/2014
|
-
|
ETHAN ALLEN INTERIORS INC. AND SUBSIDIARIES
|
10.9
|
|
Fifth Amendment to Second Amended and Restated Private Label Consumer Credit Card Program Agreement effective as of July 1, 2015, by and between Ethan Allen Global, Inc., Ethan Allen Retail, Inc., and Synchrony Bank
|
|
10-K
|
001-11692
|
10 (d)-5
|
8/12/2015
|
-
|
|
10.10*
|
|
Employment Agreement between the Company and M. Farooq Kathwari dated October 1, 2015
|
|
8-K
|
001-11692
|
10.1
|
10/2/2015
|
-
|
|
10.11*
|
|
Form of Performance-Based Stock Unit Agreement
|
|
8-K
|
001-11692
|
10.2
|
10/2/2015
|
-
|
|
10.12*
|
|
Change in Control Severance Plan
|
|
8-K
|
001-11692
|
10.3
|
10/2/2015
|
-
|
|
10.13
|
|
Credit Agreement, dated as of May 29, 2009, among Ethan Allen Global, Inc., Ethan Allen Interiors Inc., JPMorgan Chase Bank, N.A., and Capital One Leverage Finance Corp (confidential treatment requested as to certain portions
|
|
10-K
|
001-11692
|
10(g)-2
|
8/24/2009
|
-
|
|
10.14
|
|
Amendment No. 1, dated as of October 23, 2009 to the Credit Agreement dated May 29, 2009, among Ethan Allen Global, Inc., Ethan Allen Interiors Inc., JPMorgan Chase Bank, N.A., and the lenders thereunder
|
|
10-Q
|
001-11692
|
10(g)-3
|
11/9/2009
|
-
|
|
10.15
|
|
Amendment No. 2, dated as of March 25, 2011, to the Credit Agreement dated May 29, 2009, among Ethan Allen Global, Inc., Ethan Allen Interiors Inc., JPMorgan Chase Bank, N.A., and Wells Fargo Bank, National Association
|
|
10-Q
|
001-11692
|
10(g)-3
|
5/5/2011
|
-
|
|
10.16
|
|
Amended and Restated Credit Agreement, dated October 21, 2014, among Ethan Allen Global, Inc., Ethan Allen Interiors Inc., JPMorgan Chase Bank, N.A., and Capital One, National Association
|
|
8-K
|
001-11692
|
10.1
|
10/22/2014
|
-
|
|
10.17
|
|
Amendment No. 2 Dated as of September 10, 2015 to Amended and Restated credit agreement dated as of October 21, 2014 among Ethan Allen Global, Inc., and JPMorgan Chase Bank, N.A. as Administrative Agent and Syndication Agent, and Capital One, National Association as Documentation Agent dated as of October 21, 2014
|
|
8-K
|
001-11692
|
10.1
|
9/11/2015
|
-
|
|
10.18
|
|
Amendment No. 3, dated as of January 22, 2016, to the Amended and Restated Credit Agreement dated as of October 21, 2014 among Ethan Allen Global, Inc., Ethan Allen Interiors Inc., JPMorgan Chase Bank, N.A. and Capital One, National Association
|
|
10-Q
|
001-11692
|
10.1
|
1/27/2016
|
-
|
|
10.19
|
|
Second Amended and Restated Credit Agreement among Ethan Allen Interiors, Inc., most of its domestic subsidiaries, JPMorgan Chase Bank, N.A., as Administrative Agent and Syndication Agent, and Capital One, National Association, as Documentation Agent, dated as of December 21, 2018
|
|
8-K
|
001-11692
|
10.1
|
12/21/2018
|
-
|
|
10.20*
|
|
Ethan Allen Interiors Inc. Stock Incentive Plan
|
|
DEFC14A
|
001-11692
|
Appendix A
|
10/27/2015
|
-
|
|
10.21*
|
|
Form of Option Agreement for Grants to Independent Directors
|
|
10-K
|
001-11692
|
10(h)-4
|
9/13/2005
|
-
|
|
10.22*
|
|
Form of Option Agreement for Grants to Employees
|
|
10-K
|
001-11692
|
10(h)-5
|
9/13/2005
|
-
|
|
10.23*
|
|
Form of Restricted Stock Agreement for Executives
|
|
8-K
|
001-11692
|
10(f)-1
|
11/19/2007
|
-
|
|
10.24*
|
|
Form of Restricted Stock Agreement for Directors
|
|
8-K
|
001-11692
|
10(f)-2
|
11/19/2007
|
-
|
|
10.25*
|
|
Form of performance condition option agreement for employees
|
|
10-Q
|
001-11692
|
10(g)-5
|
5/1/2014
|
-
|
|
21
|
|
List of subsidiaries of Ethan Allen Interiors Inc.
|
|
-
|
-
|
-
|
-
|
X
|
|
23
|
|
Consent of KPMG LLP
|
|
-
|
-
|
-
|
-
|
X
|
ETHAN ALLEN INTERIORS INC. AND SUBSIDIARIES
* Management contract or compensatory plan, contract or arrangement
† Furnished herewith
ITEM 16. FORM 10-K SUMMARY
None.
ETHAN ALLEN INTERIORS INC. AND SUBSIDIARIES
SIGNATURES
Pursuant to the requirements of Section 13 or 15(d) of the Securities Exchange Act of 1934, the Registrant has duly caused this Annual Report on Form 10-K to be signed on its behalf by the undersigned, thereunto duly authorized.
| |
ETHAN ALLEN INTERIORS INC.
(Registrant)
|
| |
|
|
Date: August 9, 2019
|
By/s/ M. Farooq Kathwari
(M. Farooq Kathwari)
Chairman, President and Chief Executive Officer
|
Know all persons by these presents, that each person whose signature appears below constitutes and appoints M. Farooq Kathwari and Corey Whitely, and each of them, as such person’s true and lawful attorneys-in-fact and agents, with full power of substitution and resubstitution, for such person and in such person’s name, place and stead, in any and all capacities, to sign any and all amendments to this Annual Report on Form 10-K, and to file the same, with all exhibits thereto, and all other documents in connection therewith, with the Securities and Exchange Commission, granting unto each said attorneys-in-fact and agents, and each of them, full power and authority to do and perform each and every act and thing requisite and necessary to be done in connection therewith, as fully to all intents and purposes as such person might or could do in person, hereby ratifying and confirming all that said attorneys-in-fact and agents, or any of them or their or such person’s substitute or substitutes, may lawfully do or cause to be done by virtue thereof.
Pursuant to the requirements of the Securities Exchange Act of 1934, this Annual Report on Form 10-K has been signed below by the following persons on behalf of the Registrant and in the capacities indicated on August 9, 2019.
|
Name
|
Title
|
| |
|
|
/s/ M. Farooq Kathwari
|
Chairman, President and Chief Executive Officer
|
|
(M. Farooq Kathwari)
|
(Principal Executive Officer)
|
| |
|
|
/s/ Corey Whitely
|
Executive Vice President, Administration,
|
|
(Corey Whitely)
|
Chief Financial Officer and Treasurer
(Principal Financial Officer)
|
| |
|
|
/s/ Matthew J. McNulty
|
Vice President, Corporate Controller
|
|
(Matthew J. McNulty)
|
(Principal Accounting Officer)
|
| |
|
|
/s/ James B. Carlson
(James B. Carlson)
|
Director
|
| |
|
|
/s/ John J. Dooner Jr.
(John J. Dooner Jr.)
|
Director
|
| |
|
|
/s/ Domenick J. Esposito
(Domenick J. Esposito)
|
Director
|
| |
|
|
/s/ Mary Garrett
(Mary Garrett)
|
Director
|
| |
|
|
/s/ James W. Schmotter
(James W. Schmotter)
|
Director
|
| |
|
|
/s/ Tara I. Stacom
(Tara I. Stacom)
|
Director
|
72